For the first time, readers will find at the bottom of this post a shorter, more compact summary of the main article. This will be the format going forward. The summaries will be held to ~1500 words or less, generally with 1-2 visuals at most, and written to the New York Times standard reading level.
Jump down to the summary
Thank you to all subscribers for your invaluable feedback on ways to improve Cassandra Unchained.
Subscribe now
So begins the second post in the Hong Kong Stocks: Structure & Strategy series. I highly recommend reading the first post, VIEs: Vulnerability, Virtue & Value before continuing.
Every one of these companies is superficially understood by many yet truly understood by few, it seems.
Besides VIEs, there is another bug (or feature) common to each of these stocks that must be understood. For this understanding, charts are necessary.
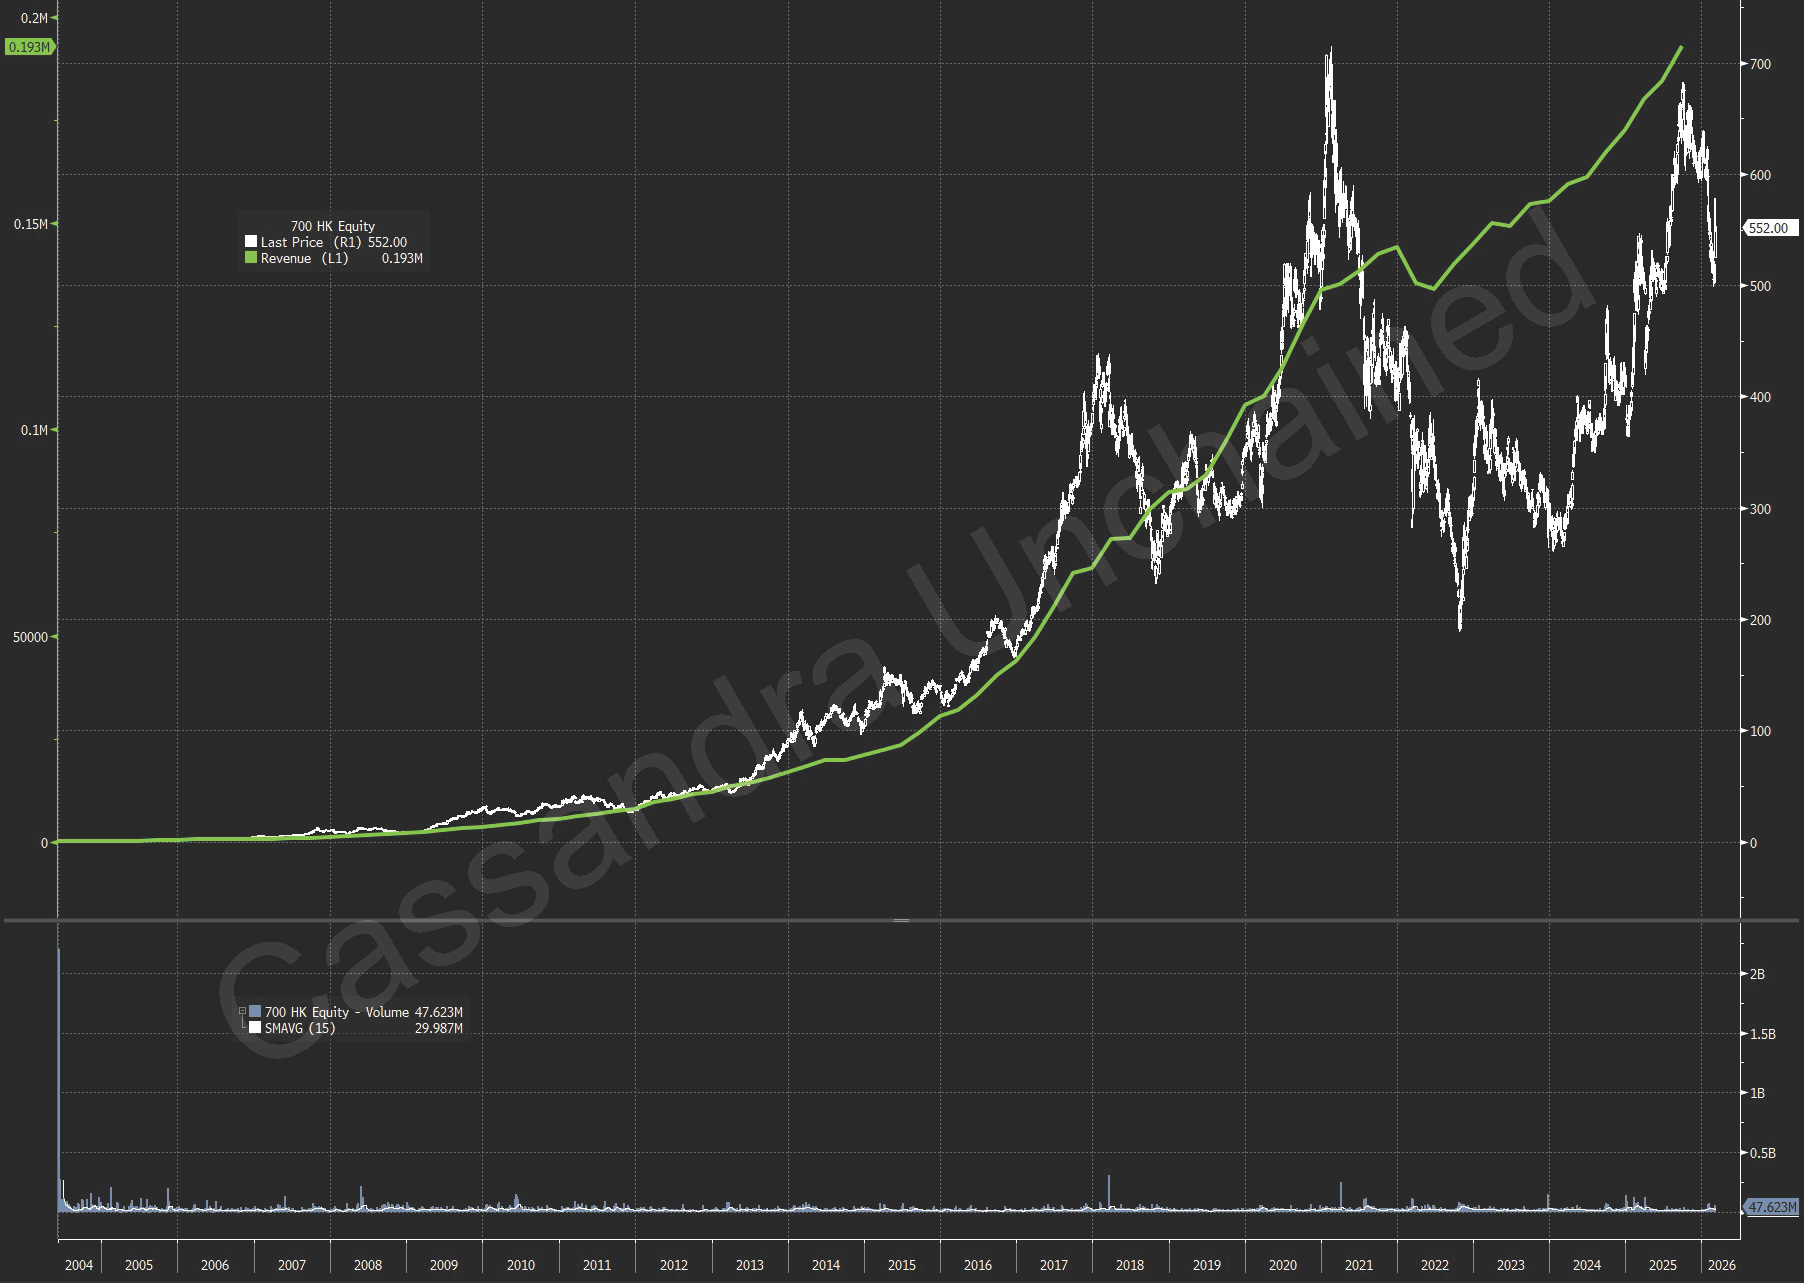
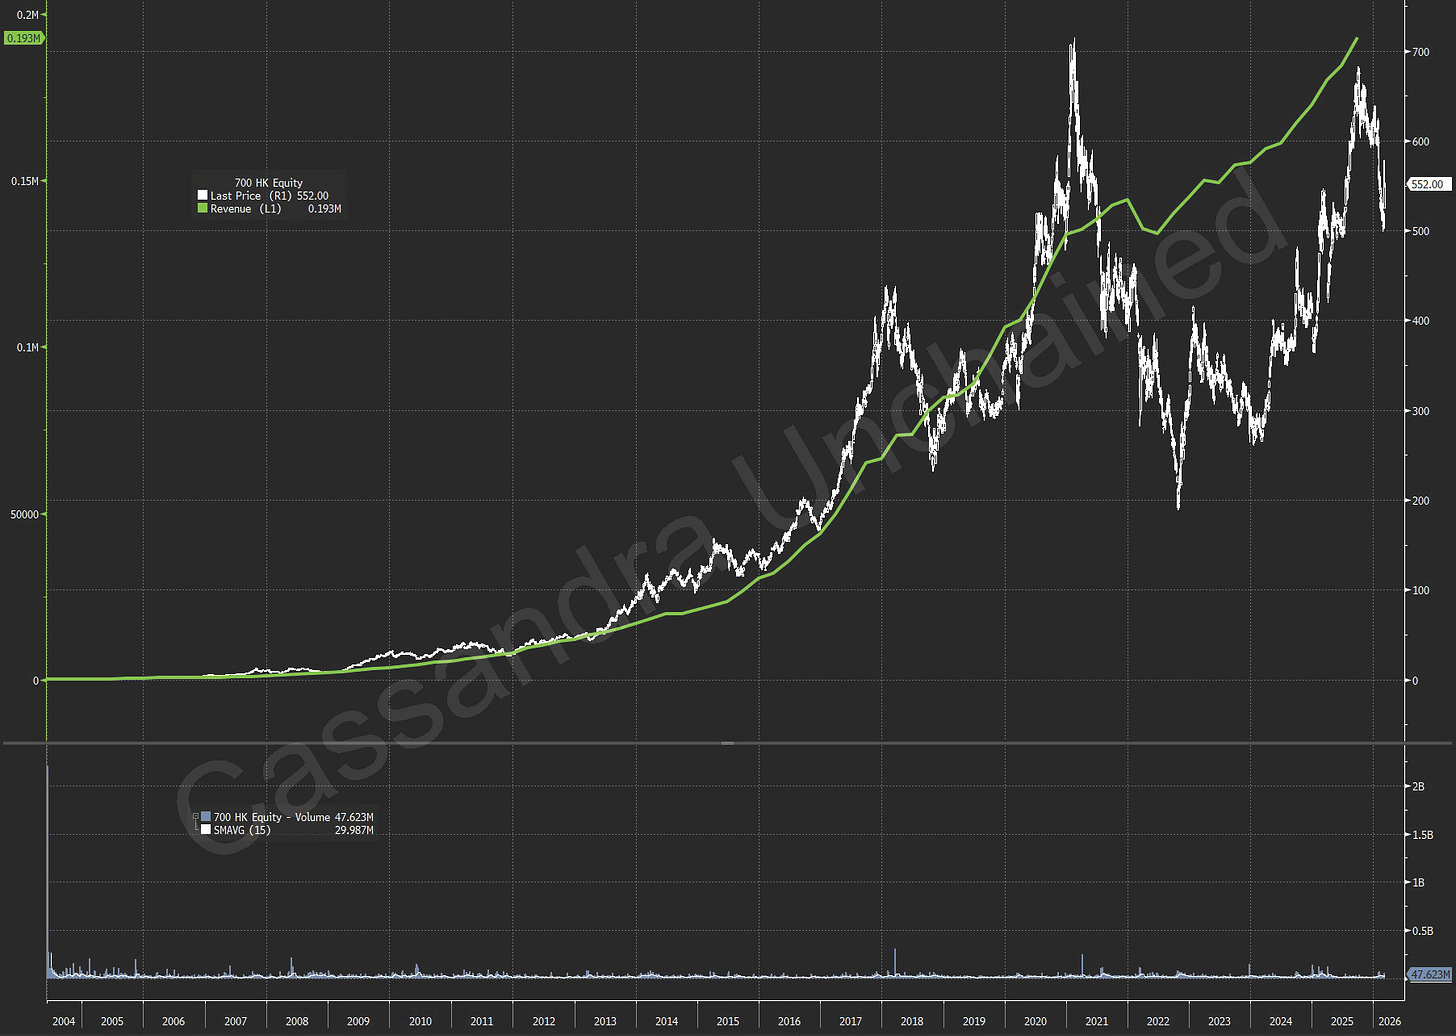
As mentioned in Part 1, Tencent was one of the very best stocks coming out of the mid-2000s as the stock price compounded at a ~35% annual rate through today. But the experience for some time now has been less enthusiastic. Tencent stock is roughly flat since November 2020.
[
](https://substackcdn.com/image/fetch/$s_!JZ9c!,f_auto,q_auto:good,fl_progressive:steep/https%3A%2F%2Fsubstack-post-media.s3.amazonaws.com%2Fpublic%2Fimages%2F92c5a859-4bfc-4800-890c-e4b3395dd319_1804x1283.png)
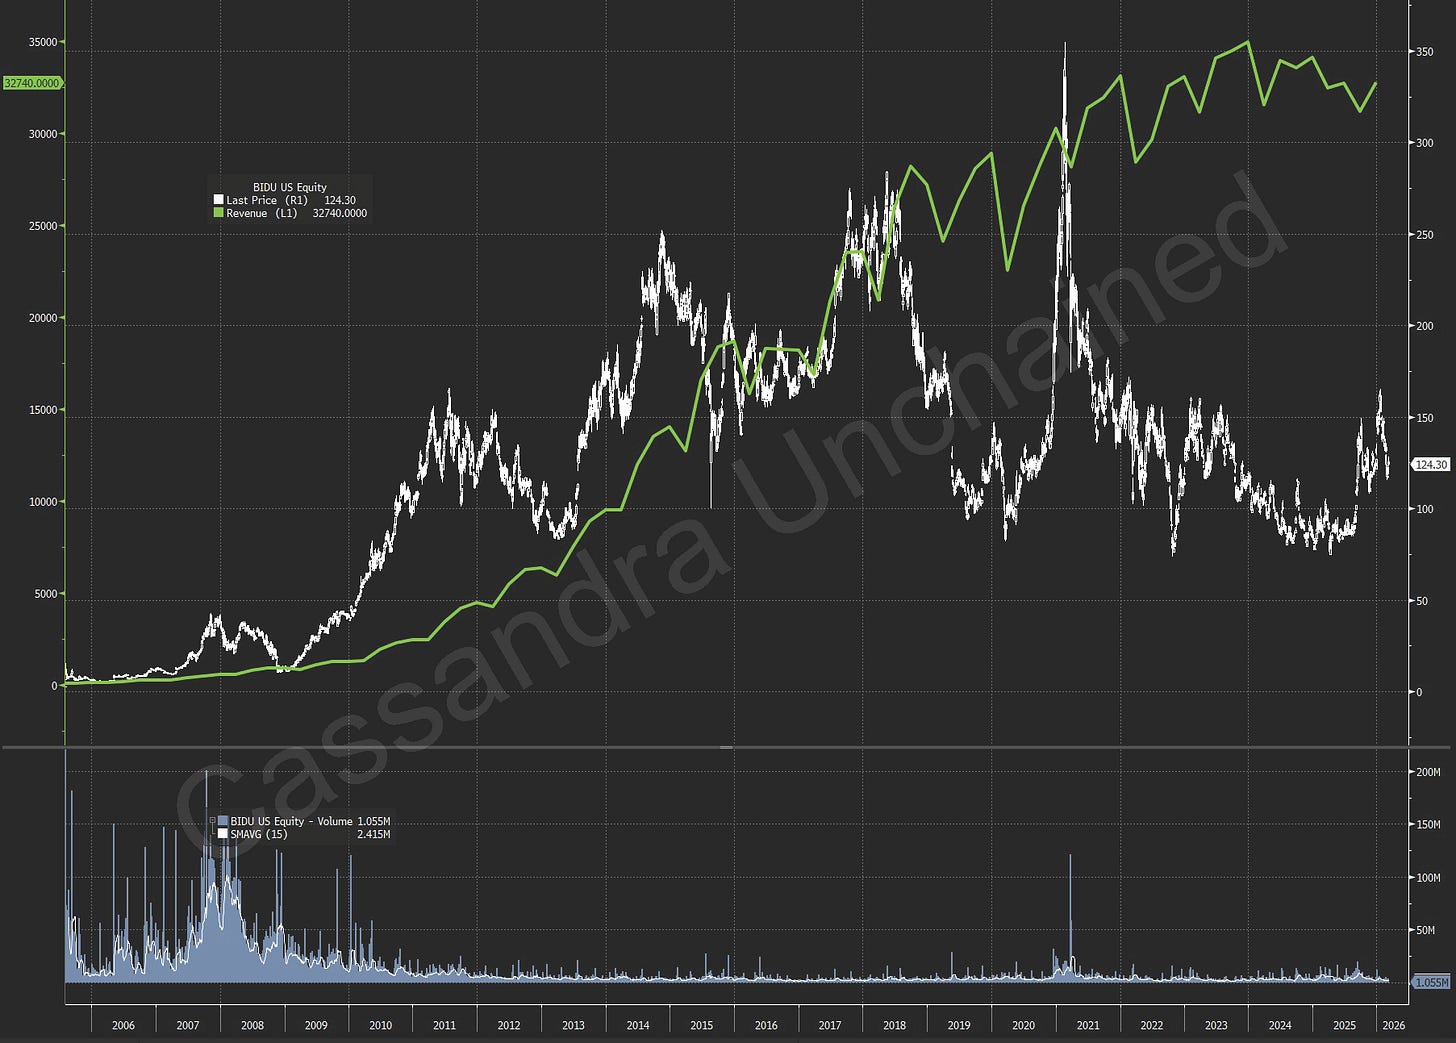
This not uncommon. Baidu IPO’d August 5, 2005 on the NASDAQ, about a year after Tencent listed in Hong Kong. Many saw it, at the time, as the Google of China – Google was relatively young then too. Baidu had a stunning run from IPO to 2018, compounding at about 20% annually. There was an ephemeral meme-fueled resurgent spike in the early 2021 frenzy, but Baidu stock today trades where it did in 2010.
[
](https://substackcdn.com/image/fetch/$s_!cARa!,f_auto,q_auto:good,fl_progressive:steep/https%3A%2F%2Fsubstack-post-media.s3.amazonaws.com%2Fpublic%2Fimages%2F11b281a1-713b-46aa-96ba-72873144848f_1805x1293.png)
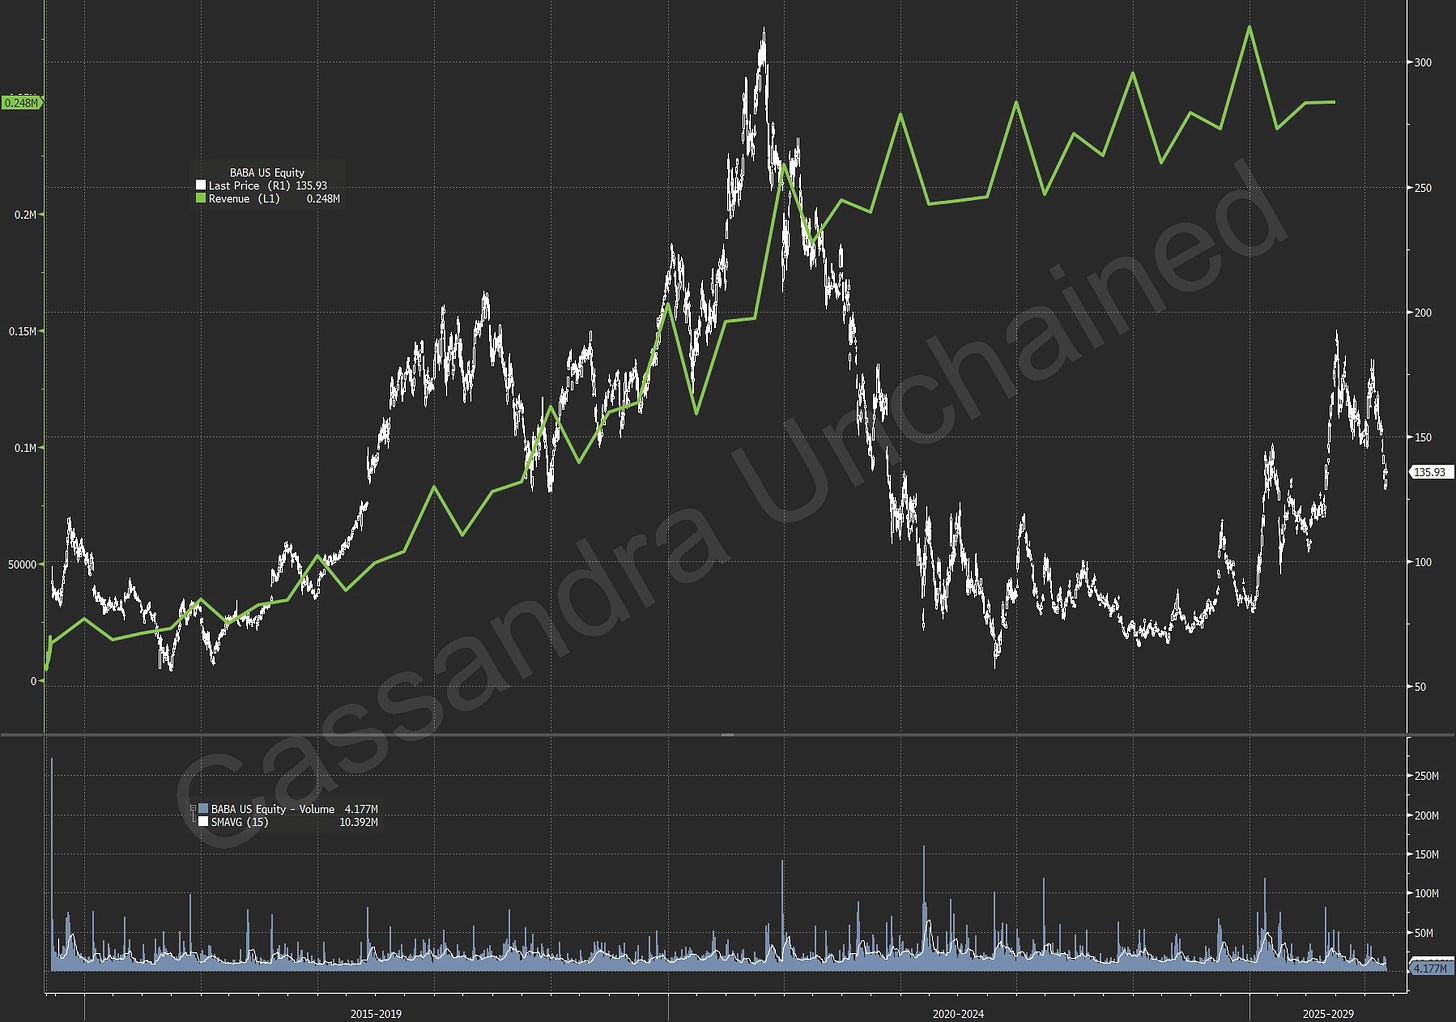
Alibaba didn’t go public until 2014. Without the benefit of that mid-2000s start, Alibaba has returned only 4% annually. At the 2024 lows, Alibaba stock traded below its IPO price a decade earlier and today trades where it did in 2017.
[
](https://substackcdn.com/image/fetch/$s_!lM5R!,f_auto,q_auto:good,fl_progressive:steep/https%3A%2F%2Fsubstack-post-media.s3.amazonaws.com%2Fpublic%2Fimages%2Ff1685074-c119-45df-b80b-dced694eba08_1798x1262.png)
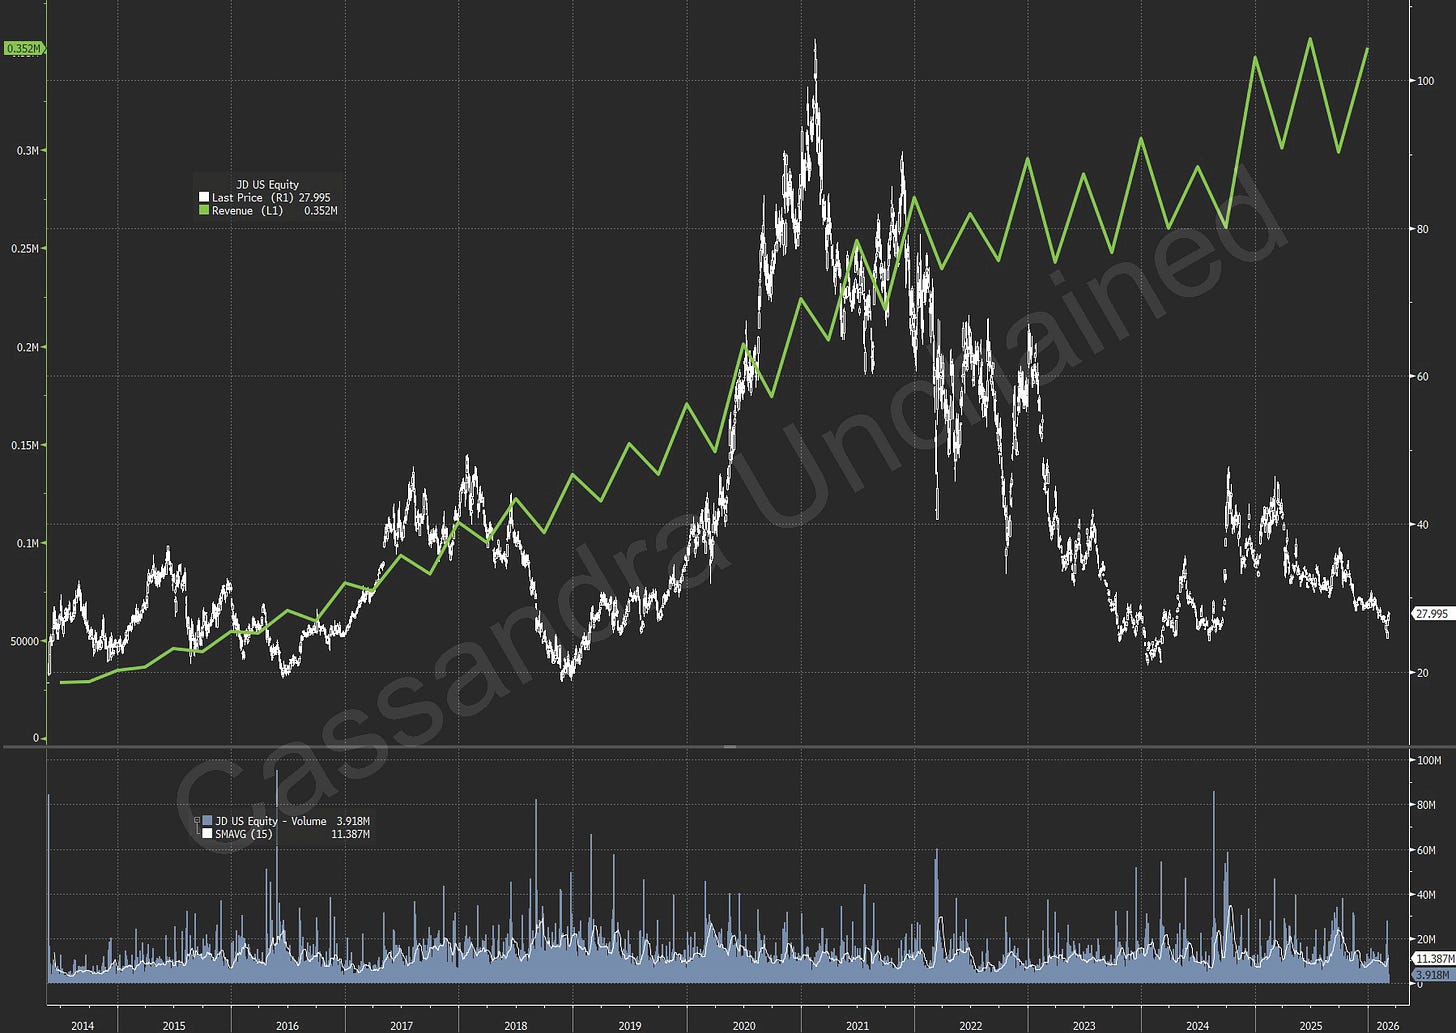
JD.com went public in 2014 too. Since the IPO, the stock has only compounded at a 4% annual return and is not very far from its all-time lows.
[
](https://substackcdn.com/image/fetch/$s_!7fnJ!,f_auto,q_auto:good,fl_progressive:steep/https%3A%2F%2Fsubstack-post-media.s3.amazonaws.com%2Fpublic%2Fimages%2Fac2d0a25-6ed2-4ff8-b365-2685255e8a7e_1798x1276.png)
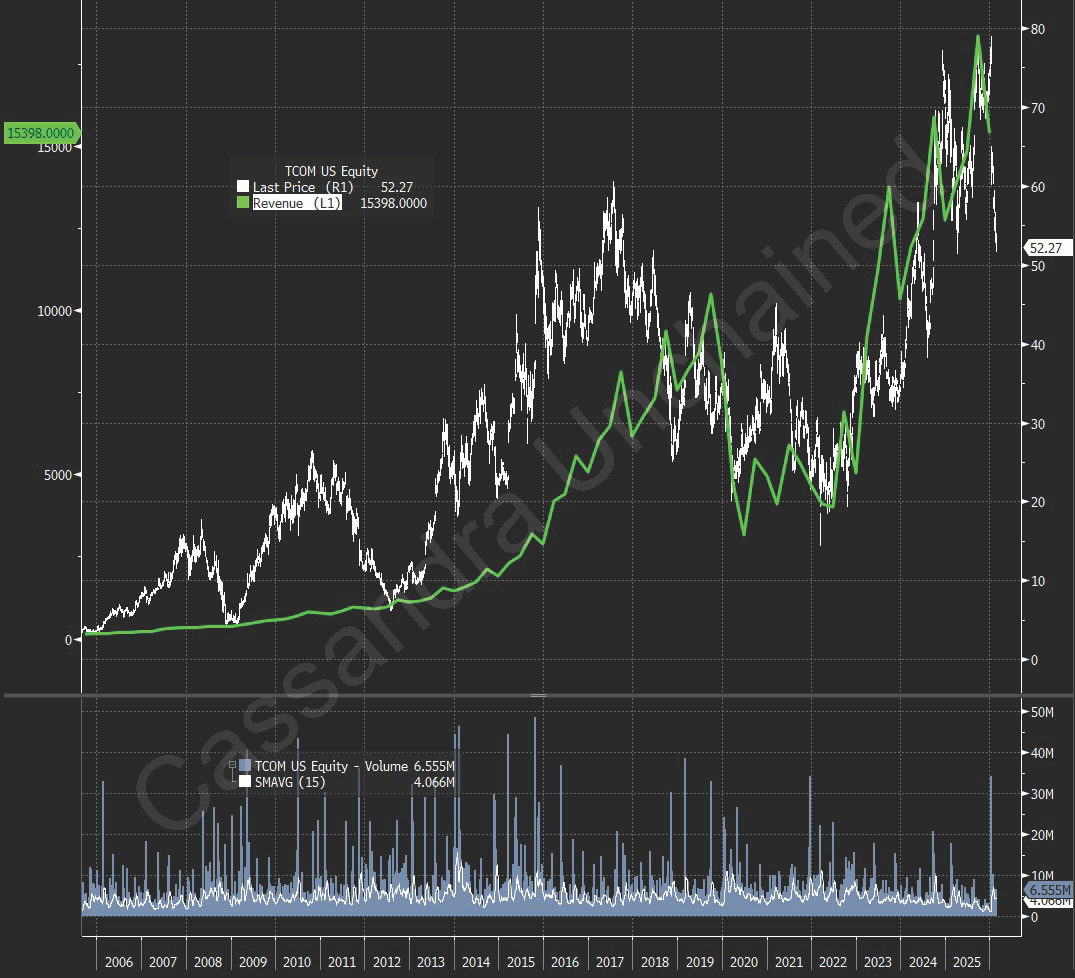
Trip.com, a Chinese online travel agency, went public in 2003 on the NASDAQ as Ctrip.com, a little earlier even than Tencent. Trip.com stock has compounded at 19.0% annually since that 2003 IPO. COVID, as we know, introduced significant volatility into the travel industry.
[
](https://substackcdn.com/image/fetch/$s_!cGVN!,f_auto,q_auto:good,fl_progressive:steep/https%3A%2F%2Fsubstack-post-media.s3.amazonaws.com%2Fpublic%2Fimages%2F9466bf60-71b3-4d86-bb41-2adf48880a67_1075x978.png)
Kuaishou is the #2 video-based social media company but did not go public until 2021. A rough start, Kuaishou is down 78%, a negative 26% annualized return.
[
](https://substackcdn.com/image/fetch/$s_!Gyrp!,f_auto,q_auto:good,fl_progressive:steep/https%3A%2F%2Fsubstack-post-media.s3.amazonaws.com%2Fpublic%2Fimages%2F4c5cea2a-1279-425f-b5b9-e0311c818205_1803x1285.png)
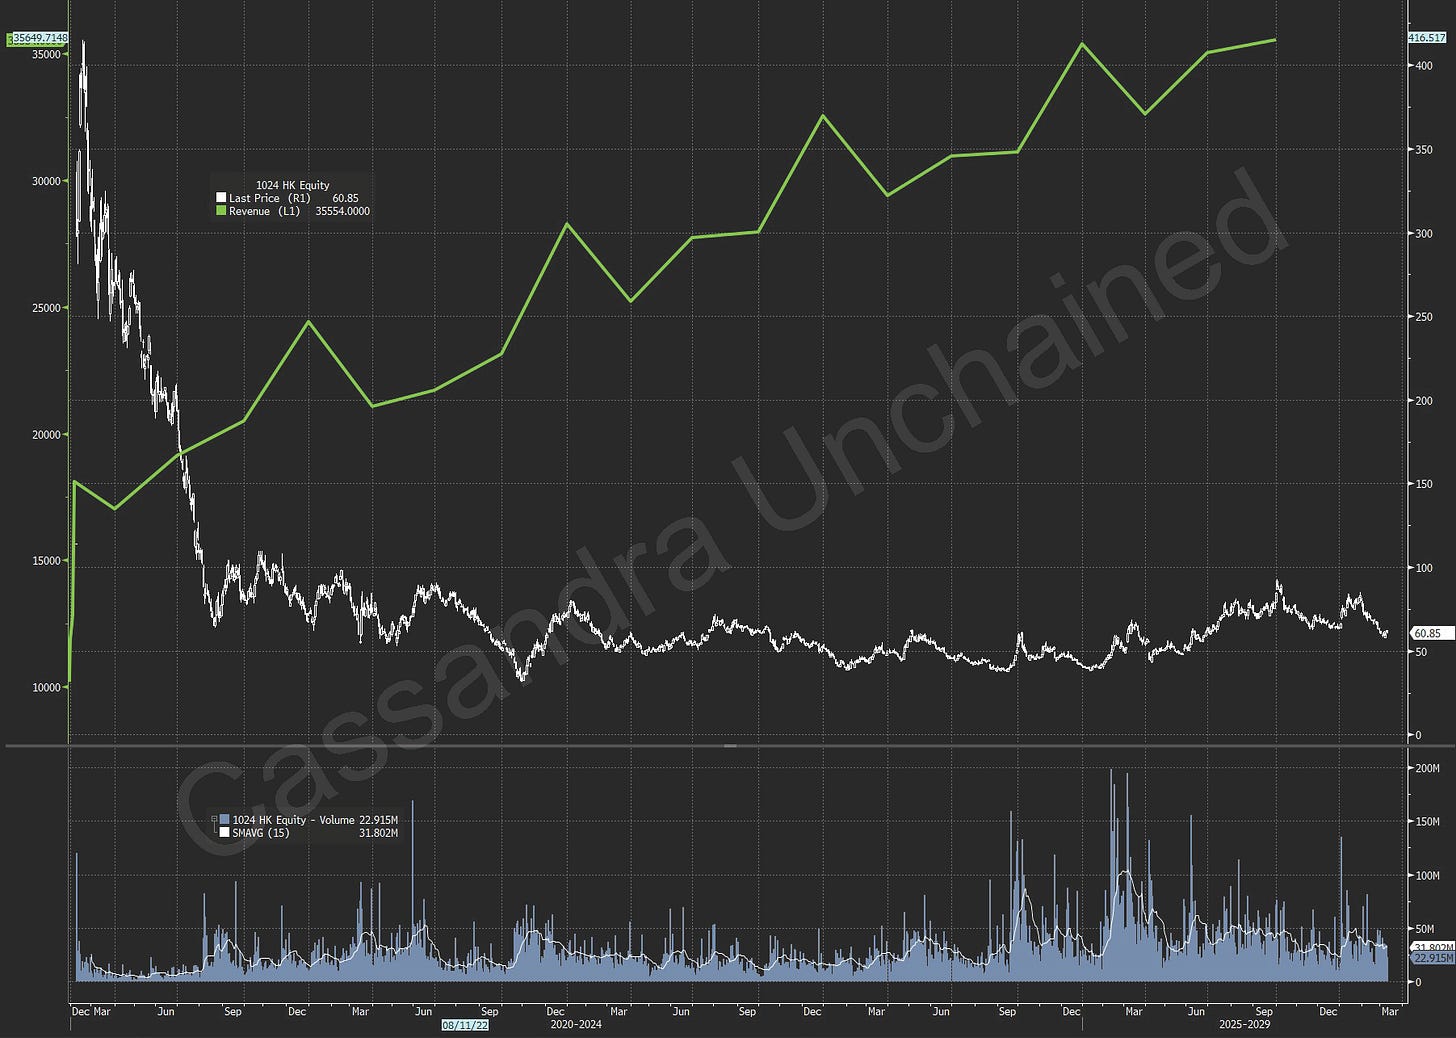
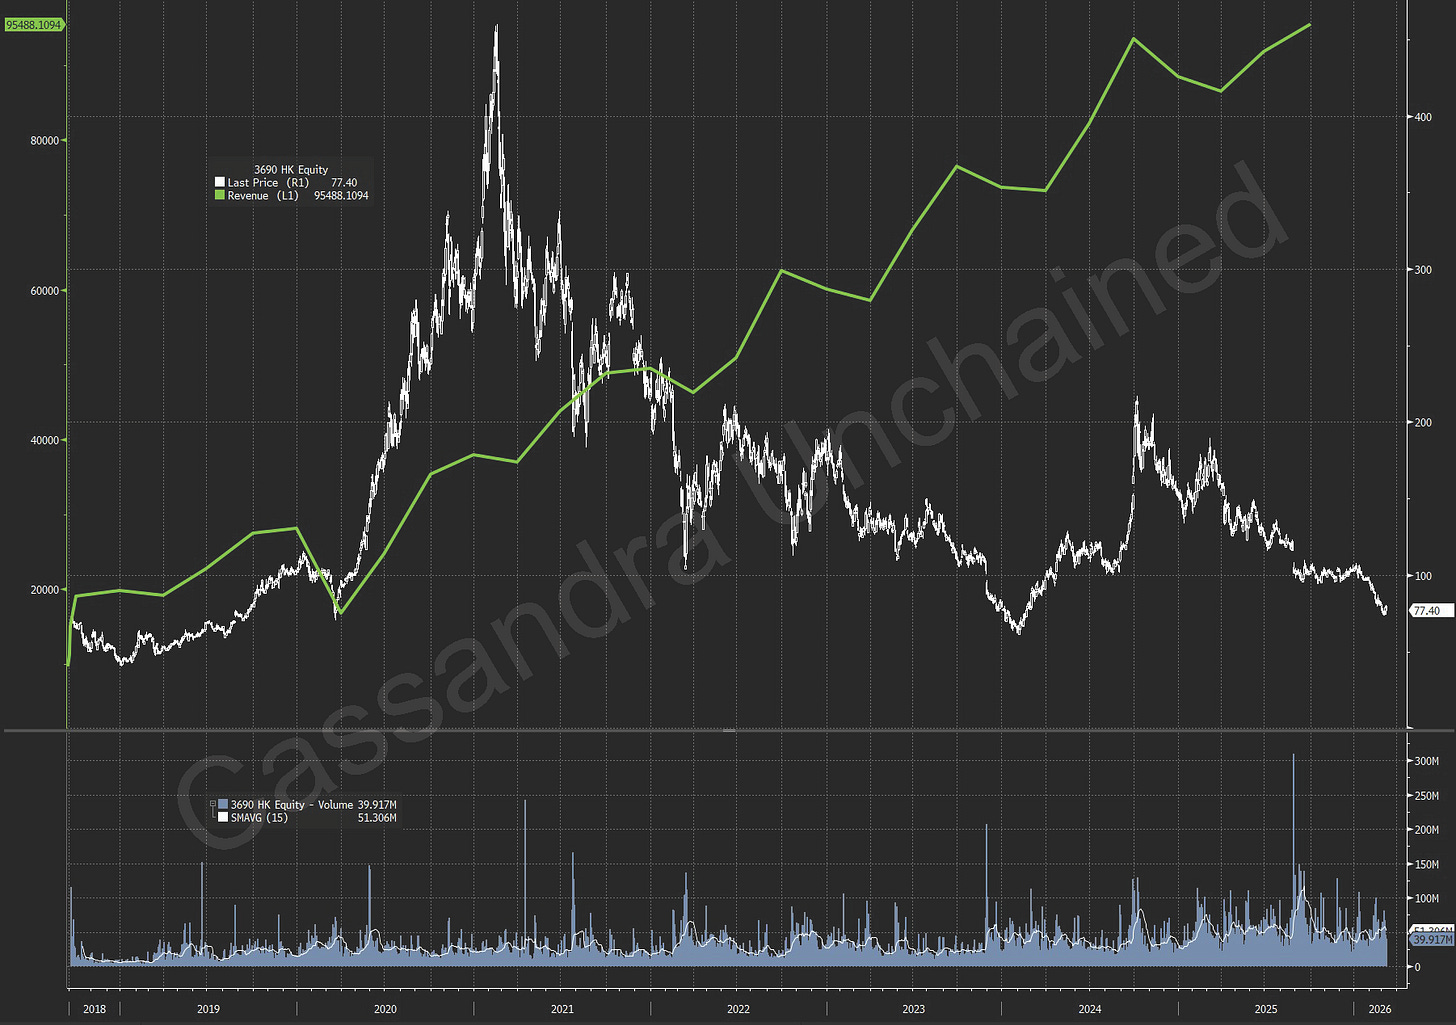
Meituan, China’s dominant food-and-other delivery company, went public in 2018. Meituan stock has fallen ~80% from its 2021 peak and has only compounded at a 5.5% annual rate since the IPO.
[
](https://substackcdn.com/image/fetch/$s_!aJvh!,f_auto,q_auto:good,fl_progressive:steep/https%3A%2F%2Fsubstack-post-media.s3.amazonaws.com%2Fpublic%2Fimages%2Fe633b512-8c78-4462-b61a-ec620beb82a1_1802x1269.png)
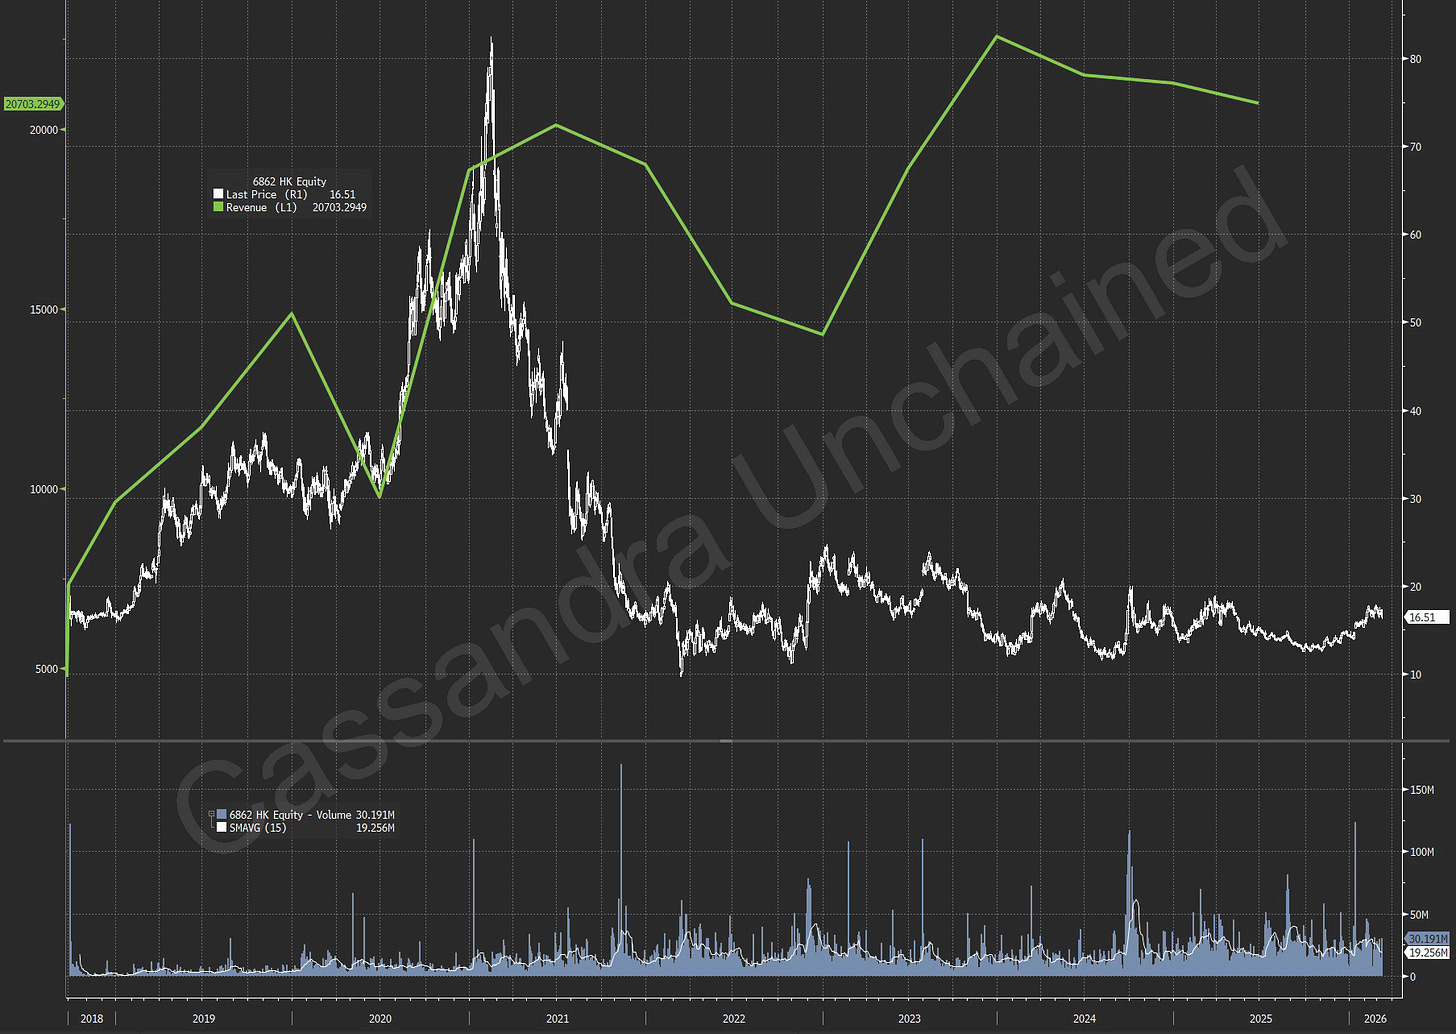
Haidilao trades ~7% lower than its 2018 IPO price, down 81% from its 2021 peak. COVID lockdowns were hard on China’s restaurant industry, and consumer spending has been in check since.
[
](https://substackcdn.com/image/fetch/$s_!dVst!,f_auto,q_auto:good,fl_progressive:steep/https%3A%2F%2Fsubstack-post-media.s3.amazonaws.com%2Fpublic%2Fimages%2Fcf4139b2-bdbb-409e-8e35-460e4d23a020_1807x1283.png)
So, what is happening here?
That green line is revenue. Take a look again at each chart. The reason for the terrible performance in no case involved a failing business. Quite the opposite. In almost every case revenue kept growing at a very healthy rate. For most, that revenue growth even powered through COVID, and the horrific Chinese lockdown.
What happened in 2021, and how come these stocks have been under so much pressure ever since?
Unfortunately, the explanation is multi-factorial. So, a list.
In October 2020, Alibaba Founder Jack Ma criticized the Chinese government for stifling innovation. Within days, Alibaba’s IPO of Ant Group, its financial arm, was scuttled. Thus began a two-year regulatory crackdown that focused on big tech companies and spanned gaming (Tencent), education technology (VIEs were not allowed for a set of education companies that wanted to go public), food delivery, e-commerce, and ride-hailing (Didi). Beijing exercised its anger month upon month and year upon year, though there has been change of late.
November 2021 was the month bubbles around the world popped. NFTs, crypto, watches, meme stocks, SPACs, you name it. Hong Kong stocks had lightly participated in the folly and were vulnerable as risk-off sentiment swept the world. While stock markets in the U.S. and other countries bottomed in 2022, China’s lockdowns were just getting started.
The Chinese property market bust alone would have created China’s version of the GFC, but in some ways it was even worse. The property sector was 30% of China’s GDP, 40% of local government revenue, and 2/3 of household assets at its peak. All far greater than the U.S. prior to the GFC. Property was the savings/investment account for the entire urban population of China. In August 2020, Beijing capped leverage ratios at the property developers to rein in speculation. Instead, the regulatory action revealed a Ponzi scheme of debt in the property sector. Evergrande’s liabilities of $335 billion were ~3x its annual revenue. Evergrande and 50+ other developers collapsed over the next few years. Household wealth destruction has been estimated at $5-$10 trillion. It is hard to fathom that much money lost in the U.S., let alone China. In fact, in the U.S., at the same time, the government was handing out $5-$10 trillion in forgivable loans, stimulus check and other gifts to its citizenry.
China’s COVID Zero policy led to lockdowns unlike any other country. Nightmarish scenes were filmed on phones and uploaded online. The crackdown/lockdown came in 2022, later than some other countries, but coinciding with just about everything else going wrong, as described above. Youth suicide rates doubled. In April 2022, retail sales fell 11% and industrial production crashed. Permanent damage included significant pay cuts for white collar and civil service employees alike. This triggered the already-high Chinese savings rate to spike higher still – household savings surged 81% in 2022 from 2021, directly stealing from consumption. Then, when China let up on the lockdowns, China endured an acute COVID pandemic anyway. Hundreds of millions of Chinese people caught COVID, and the hospital overload was yet another memorable nightmare that continues to suppress sentiment in the country and lead consumers to save rather than spend.
China continues to bully others in the South China Sea, and the risk of an invasion of Taiwan has hung heavy over foreign investors fearful of sanctions in the event of a China attack. Polymarket still predicts 30% chance of invasion by 2030, as discussed in Part 1.
So, China’s stock markets are suffering to a greater degree and for a longer time than the GFC in the United States. In fact, most of the stock charts above look like U.S. stocks after 1929 - at their lows, down 80% or more.
Still, the same charts show sales grew at almost every major company. A sign, maybe, that Chinese economic numbers are not as inflated, or as bad, as many say despite the appearance of a perfectly wretched storm.
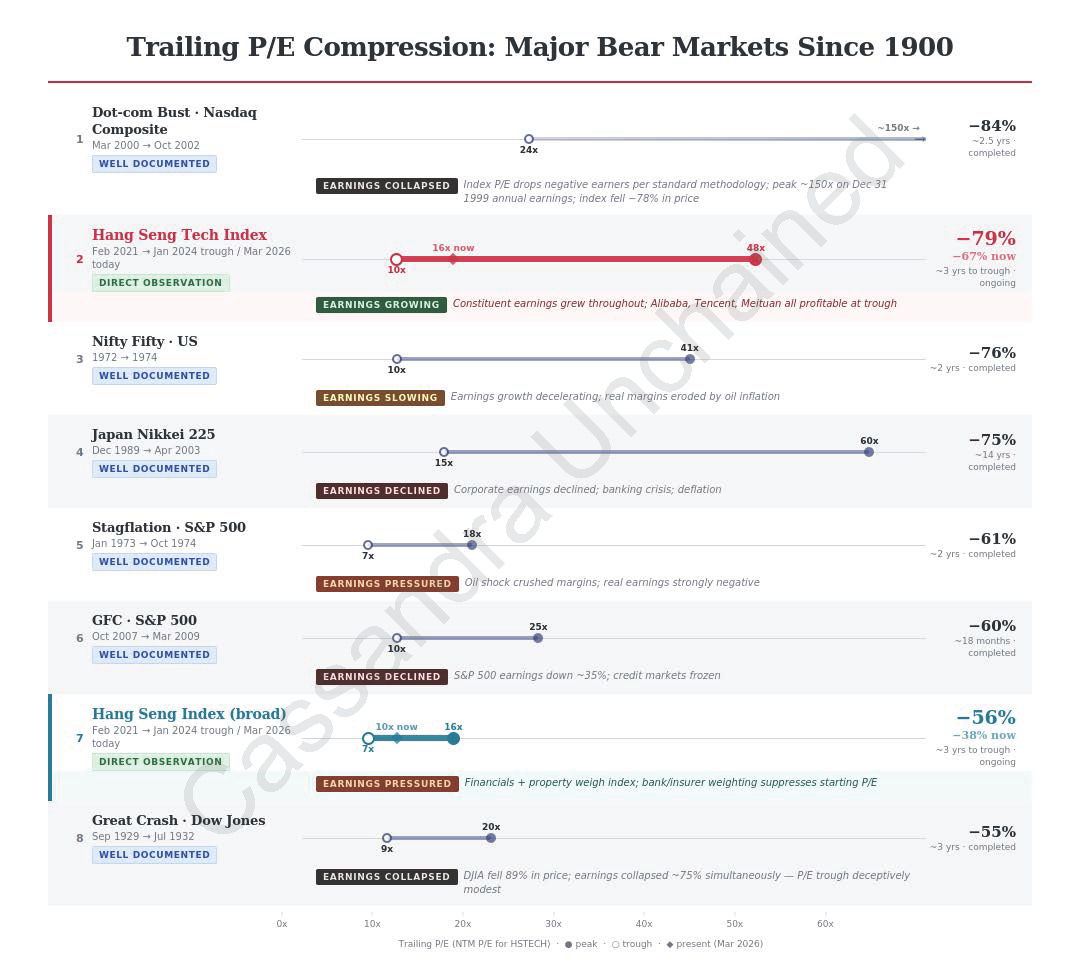
The primary historical cause of major bear markets is multiple compression – collapsing PE, EV/EBITDA or EV/Sales ratios. Hong Kong’s multiple compression during the current bear market ranks with the worst in developed markets history.
Below, a comparison of multiple compression among major index bear markets from 1900 to present. Bear with me. The comparison chart below uses trailing PE ratio.
[
](https://substackcdn.com/image/fetch/$s_!GRQW!,f_auto,q_auto:good,fl_progressive:steep/https%3A%2F%2Fsubstack-post-media.s3.amazonaws.com%2Fpublic%2Fimages%2F785237e5-53a7-4c13-a379-1e7cacbb14c5_1080x961.png)
Comparing crashes is difficult, especially across long periods. In this chart, the NASDAQ tech bust is the worst in history, with a very high PE ratio at the start. Generally, the chart reveals the worst multiple compressions start from the higher PE ratios. The Hang Seng Tech Index was up there too - irrational exuberance not so very long ago.
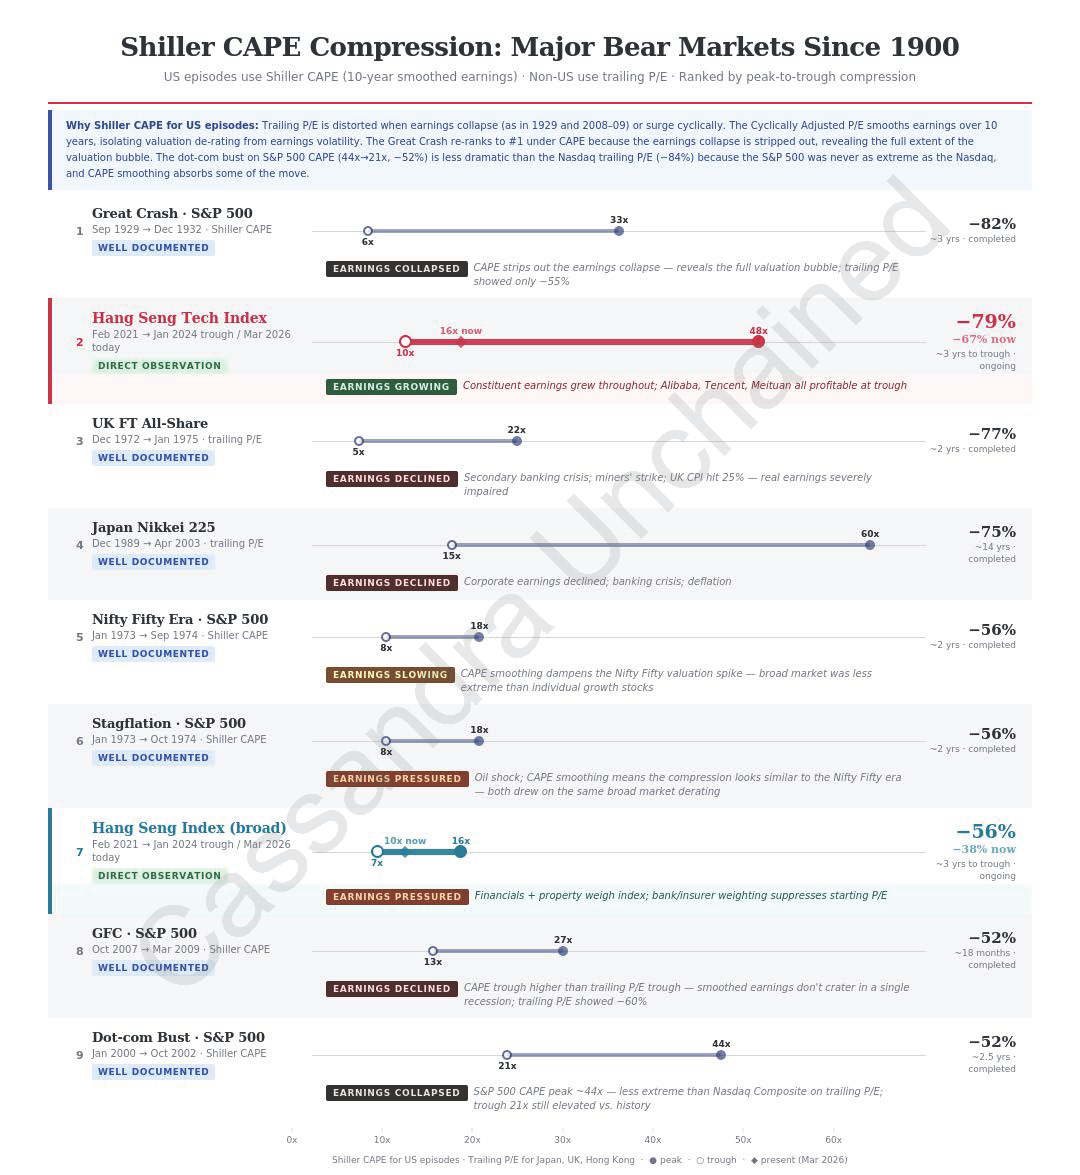
Below I will present another chart, this one using the Shiller Cyclically Adjusted PE (CAPE) ratio for the American indices. The Shiller methodology is better for comparisons across many decades, and good data on America’s great stock crashes span more than a century.
Shiller CAPE data exists for the S&P 500 and its historical analogues. Therefore, in the chart below, an S&P 500 Index analogue replaces the Dow Jones Industrial Index for the Great Crash of 1929. The chart also replaces the NASDAQ Composite Index with the S&P 500 Index for the Dot-com Bust of 2000. The S&P 500 Index is of course less volatile, and the Shiller methodology even more so.
Note, I say Dot-com here but as I have stated in The Cardinal Sign of a Bubble: Supply Side Gluttony, the 2000 NASDAQ crash was much more than “Dot-com.” Speculative lunacy encompassed epic overinvestment in data transmission, and it was this that gave the bust legs.
[
](https://substackcdn.com/image/fetch/$s_!JoKo!,f_auto,q_auto:good,fl_progressive:steep/https%3A%2F%2Fsubstack-post-media.s3.amazonaws.com%2Fpublic%2Fimages%2F4194bc4a-3a67-4d52-ba54-1c02d040936f_1080x1175.png)
This is interesting. Using the Shiller CAPE methodology instead of trailing PE ratios for the same study of American major bear markets, the Great Crash of 1929, represented here by an S&P 500 analogue, now takes the same place on the list that it occupies in our collective institutional memory - first.
The Hang Seng Tech Index crash remains #2 under this methodology.
Subscribe now
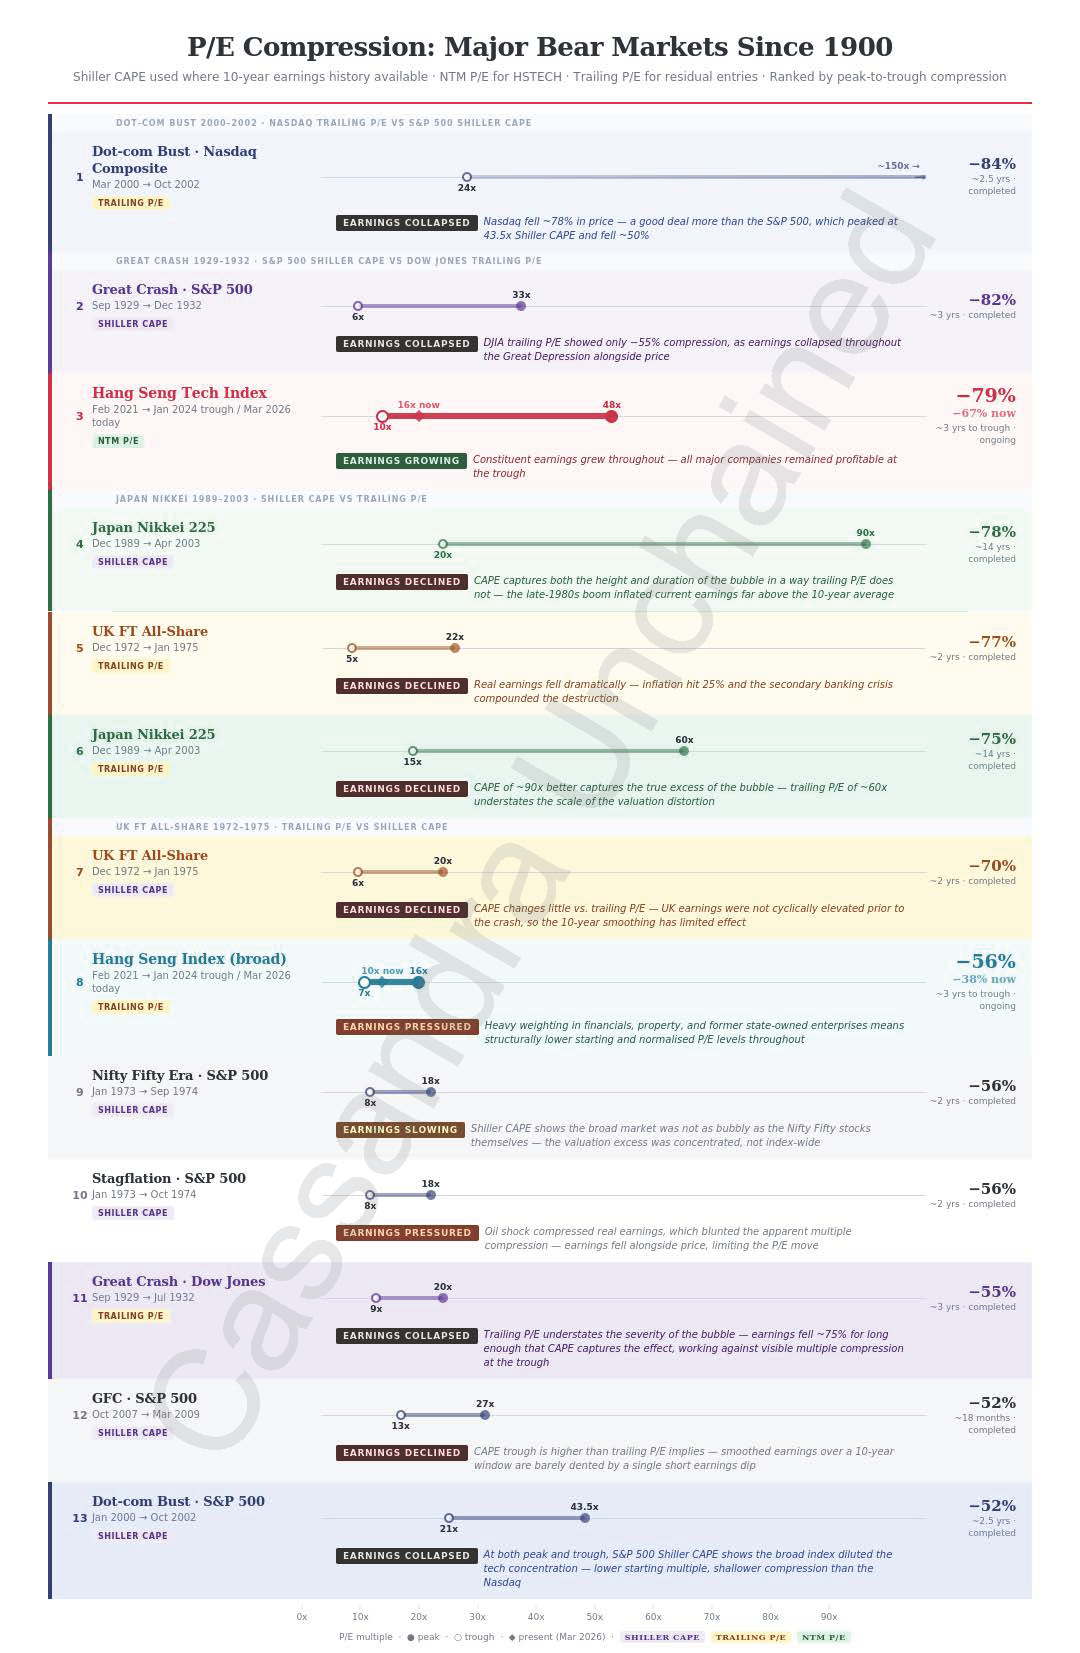
I present the final chart in this study below, and here I combines the two methodologies. The NASDAQ Dot-com Bust is back, as is the Dow Jones Great Crash of 1929, both calculated using trailing PE ratios. The CAPE methodology remains, and in fact, Shiller CAPE studies are added for the 1990s Nikkei crash as well as for the 1970s UK FT All-Share crash.
[
](https://substackcdn.com/image/fetch/$s_!Aguj!,f_auto,q_auto:good,fl_progressive:steep/https%3A%2F%2Fsubstack-post-media.s3.amazonaws.com%2Fpublic%2Fimages%2Fdc4c59d6-a061-4a1c-af03-4e0566a8fc4c_1080x1653.png)
Students of bear market history will hopefully find the above juxtaposition of busts interesting. The NASDAQ’s fall from 2000-2002 ranks first, replacing the CAPE version of the Dow Jones Index Great Crash of 1929, again represented by the S&P 500 Index analogue.
The Hang Seng Tech Index slump, now in its 5th year, ranks second or third across all manifestations of this bear market multiple compression study.
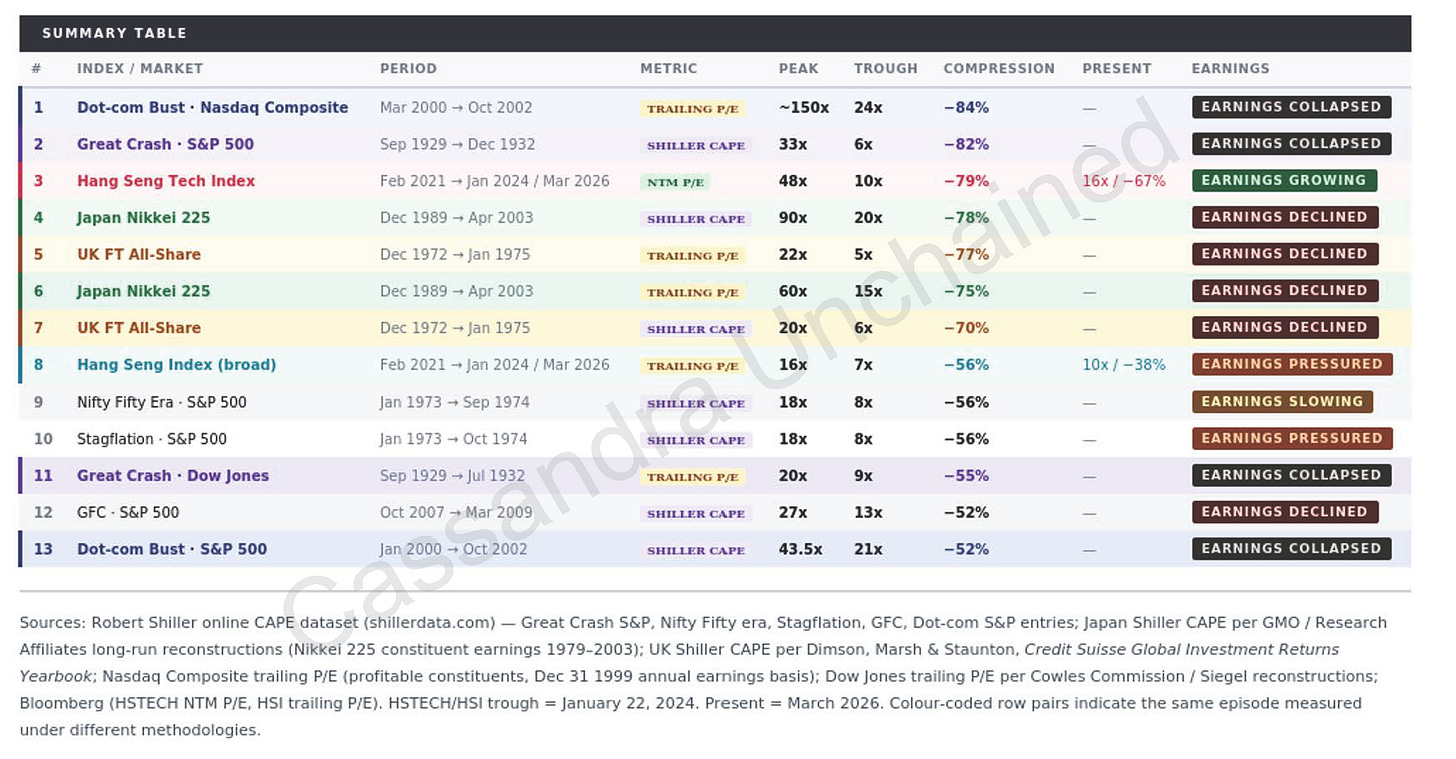
Speaking of juxtaposition, the summary table below brings home the point of all this. Note the lonely green bar on the right.
[
](https://substackcdn.com/image/fetch/$s_!TuhY!,f_auto,q_auto:good,fl_progressive:steep/https%3A%2F%2Fsubstack-post-media.s3.amazonaws.com%2Fpublic%2Fimages%2F8fc541e5-5265-40e5-ba09-ba9948d4f28f_1747x911.png)
The Hang Seng Tech Index is the only one of the 11 major bear markets studied that has shown earnings growth during the stock market crash.
The Hang Seng Index – as opposed to the Hang Seng Tech Index – also ranks among the greatest bear markets under each methodology. This index is heavily weighted with financials, property firms and formerly state-owned enterprises. The PE compression there is from a lower level - 16 to 7, on trailing PE multiple – and not too surprisingly (for me) compares well with the 1929 Crash for the Dow Jones Industrials Index.
No other major index, major bear market in recorded history saw its constituent earnings grow through the crash, making the Hang Seng Tech Index collapse the only one that is due entirely to multiple compression, i.e. valuation and sentiment.
Of course, the Hang Seng Indices are also the only major bear markets currently in force. All of this mandates a hard, forensic look at Hong Kong stocks.
These will be deeper dives than I had originally conceived. The full picture of each company includes whether it is a VIE or not, the meaning of which deserves a refresh.
VIE Structure Review
I have previously assessed Hong Kong stocks’ relative value versus American technology and consumer stocks, and I explained the risks and realities of the VIE ownership structure often cited as the reason to avoid investing in Hong Kong.
To review briefly, I am comfortable investing in Hong Kong for a number of reasons, starting with the $200+ billion that Chinese mainlanders invest in VIE-structured Hong Kong stocks.
As well, the VIE structure is the bona fide structure of the entire company, with no separate “real” or “ true” shares. All shares of these major companies are shares in the Cayman offshore holding company that is the only gateway to ownership, even for Chinese mainlanders.
These are the largest tech and media companies in China, and they cannot be disrupted by Beijing without absolute chaos in Chinese society. The Sword of Damocles remains at Beijing’s hip, sheathed.
Finally, the U.S. is far more likely to act against VIEs than China, but the U.S. cannot touch the value of the VIE. Other than the Cayman Offshore Holding Company, the rest of the structure, including the VIE, is domiciled inside China. My detailed logic can be found in VIEs: Vulnerability, Virtue & Value.
With that, here we go.
Subscribe now
BYD (1211 HK)
BYD, a dominant electric vehicle (EV) and battery manufacturer based in China but expanding rapidly internationally, does not use the VIE structure. As BYD is not in a restricted industry, shareholders directly hold common shares. BYD trades its common shares, all with the same voting rights and the same dividend entitlement, in both Hong Kong and on the Mainland. The Hong Kong shares are called the H shares. The Mainland shares are called A Shares.
Founder Wang Chuanfu owns ~17%, and the founding team overall owns ~30%. Every one of these shares is the same exact share that you or I could buy. Berkshire Hathaway had a great return in BYD after a decade+ hold, but sold its last shares some time ago.
BYD is potentially the lowest-cost producer of vehicles in the world thanks to its vertically integrated model at scale. BYD controls its supply chains and saves margin at every step. It makes its chips, batteries, bodies, motors, etc.
BYD’s semiconductor arm is not limited to supplying auto companies. Baidu, Xiaomi, Huawei are customers as are industrial companies, renewables companies, and home appliance companies.
The Battery Innovation
BYD’s Blade battery is a leading-edge Lithium Iron Phosphate (LFP) chemistry battery. LFP batteries are chemically stable and do not release oxygen easily under thermal stress so do not easily burn in runaway fashion like Nickel-Manganese-Cobalt (NMC) batteries. LFP batteries are ~30% cheaper as well as safer, but pack ~30-40% less energy per kilogram than NMC batteries.
Across millions of vehicles, this is a significant cost advantage. Still, if NMC batteries have 50-75% more energy per kilogram, NMC might seem worth it. Tesla and others historically used NMC.
BYD’s Blade system eliminates the weight and space of the module to compensate. This innovative solution involves sliding long flat cells into a pack that acts as a structural part of the chassis. This increases its volume/energy efficiency by >50% according to BYD.
CATL is a direct battery competitor. It has an NMC battery system that, when paired to a chassis built for it, achieves 72% volumetric utilization and 255Wh/kg energy. This is all according to CATL, but seems favorable against BYD’s LFP new Blade system with 66% and 200Wh/kg.
CATL controls just under 45% of global EV battery share and is a pure third-party supplier that makes both chemistries, LFP and NMC.
BYD’s Day 1 platform design around the Blade system is comparable to Tesla’s Day 1 platform design around CATL’s battery system, but Tesla is a customer and negotiates away margin into the supply contract.
BYD not only captures that margin but sells the Blade batteries (branded FinDreams) to Toyota, Tesla (for its Megapack energy storage), Xiaomi, BorgWarner, LG and many more. BYD supplies all of these as standardized products without meaningful customization beyond dimensional variants.
The cell-to-body/chassis integration – that BYD retains for its own vehicles -minimizes the LFP-NMC energy differential and is a cost and performance advantage for BYD, which also retains the safety advantage by using LFP over NMC.
In fact, Tesla’s standard range Model 3 and Y are LFP, not NMC, in part because BYD legitimized LFP by innovating the cell-to-pack architecture that moved the industry in that direction. This is a global transition away from NMC.
CATL is still the dominant supplier. I will examine CATL (3750 HK) in more detail later, though I will note it listed in Hong Kong during May of 2025, and now trades ~40 times earnings, >5 times sales. Hold that thought.
BYD is a low-cost leader, a safety leader. Safety is especially important. Drive a nail into an NMC cell, it catches fire, runs away into neighboring cells, which catch fire, etc. Drive a nail into a Blade LFP cell, it gets a bit warm and damage is contained.
Financial Power
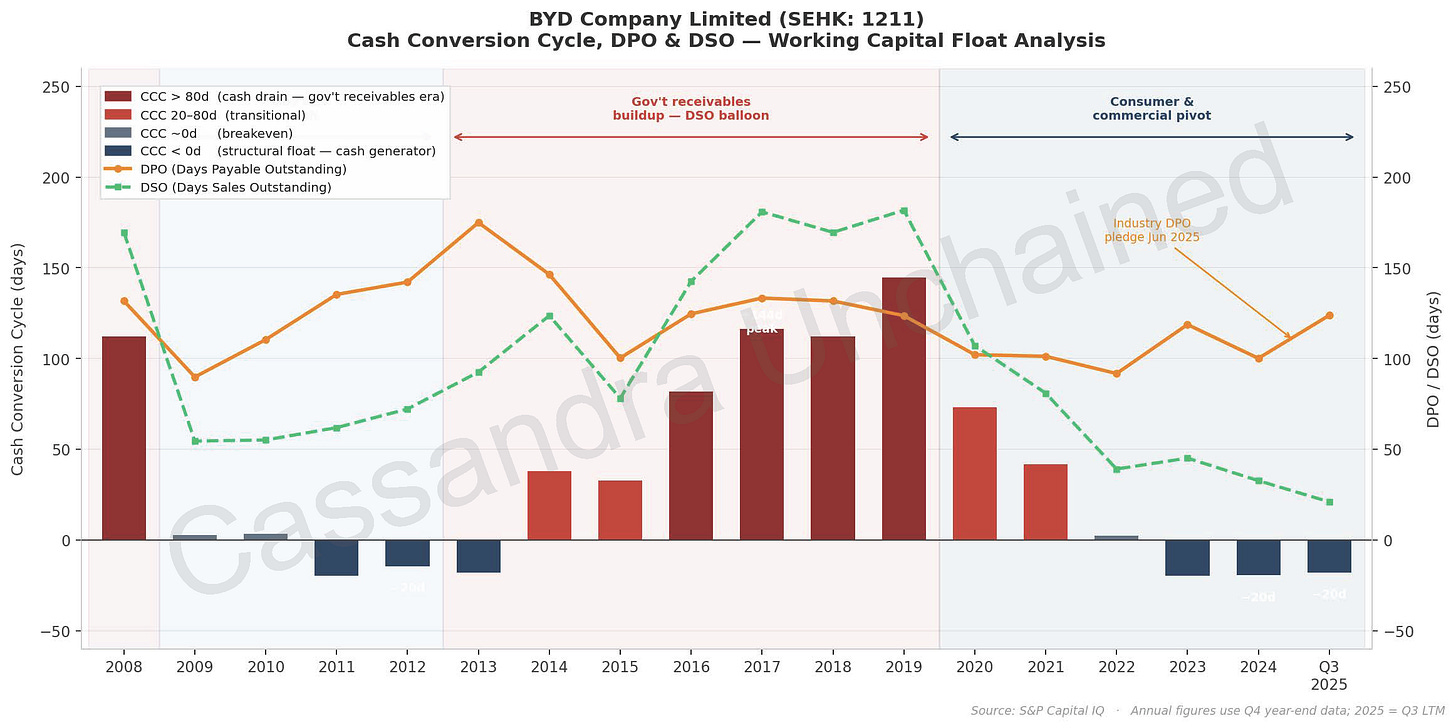
BYD showcases significant leverage with its third-party suppliers by carrying a significant float of payables (DPO is 100 days), which inflates operating cash flow. The dramatic drop in receivables days (~33 days sales outstanding or DSO) along with the expansion in payables days, as BYD moved from government to consumer/commercial, amounted to a ~$5-6 billion windfall and funded its global factory buildout to a significant degree. This may have been one of Berkshire’s key insights.
Note, BYD’s finance arm receivables, if included, would roughly double DSO, but these reflect loan asset receivables, not operations. The numbers above are focused on the manufacturing operations and the position of that business. The numbers in the chart below represent manufacturing, without finance included, as well.
[
](https://substackcdn.com/image/fetch/$s_!JXwd!,f_auto,q_auto:good,fl_progressive:steep/https%3A%2F%2Fsubstack-post-media.s3.amazonaws.com%2Fpublic%2Fimages%2F8af82254-161b-4448-be2a-12aa51180e3a_2324x1162.png)
The chart above shows BYD’s evolution over the last two decades.
2009-2013, batteries and handsets were the main products, and BYD expanded days payable outstanding (DPO) as BYD’s growing size gave it leverage over its suppliers.
2014, Beijing dramatically expanded EV subsidies, and pushed the government fleet to go EV. From 2014-2019, government purchasers sent BYD subsidy payments and payments for EV fleets - very slowly. Government receivables exploded faster than supplier leverage. Accounts receivable rose to 180 days sales outstanding (DSO), and BYD’s cash conversion cycle (CCC) rose to a rather toxic +144 days at the peak.
From 2020 on, BYD has focused on consumer/commercial sales, driving DSO to all-time lows and sending the cash conversion cycle negative the last three years. This is the working capital float that benefits BYD - the same ~$5-6 billion working capital release that continues to fund BYD’s international expansion, as mentioned above.
Now, BYD may face the reverse. In June 2025, an industry group pledged to reduce payables outstanding throughout the industry. If BYD complies, and it looks like it is unwinding its notes system with its suppliers, that could be a ~$10 billion one-time cash flow hit. Of course, it would hurt most Chinese car companies, but BYD has more to lose on a relative basis because the notes system it used is rather unique to BYD. Clarity on this could drop BYD’s stock, creating a potential buying opportunity. This is one of the negative catalysts I hope moves BYD stock to my preferred target buy price.
BYD expenses against operating income is an incredible 94% of R&D, and R&D is growing faster than revenue, so the R&D drag on earnings continues to grow. BYD’s margins appear like typical car companies at a little less than 5%. However, by only capitalizing 6% of R&D rather than the typical 30% or so at peers, BYD’s earnings sit about 25% lower than they would, apples to apples. For 2025 through the first three quarters, BYD’s total R&D nearly doubles BYD’s net income, $6.0 billion to $3.2 billion.
Overseas revenues are 29% of the total and are the growth driver. Factories are being built in Thailand, Brazil, Hungary, and Turkey. Europe put a 17% tariff on BYD cars, but 35% on other Chinese auto companies. Once local production is in gear, the tariff will disappear - a major future competitive advantage in Europe given BYD’s low cost advantage.
BYD has wisely not been targeting the United States. The China aversion here is bipartisan and helps Tesla keep its illusion going with U.S. investors.
BYD is facing increasing competition at home with over 125 Chinese EV brands. It has size and a significant durable cost advantage. BYD is profitable at its selling prices while most every major Chinese EV competitor is not. BYD’s R&D spend and lead is widening.
For now, the war of attrition continues – BYD’s 3Q2025 showed double digit quarter-on-quarter earnings declines in China. For the year, the decline is about 7.5%. BYD will retain its top position over the long run, and should remain profitable under any scenario. If BYD does not make money, competitors will go out of business, and BYD will improve its competitive position.
BYD has world-class disclosure, best in class with Tencent among Chinese companies I have examined, and no other Chinese company we are discussing in this series, other than CATL, is expanding overseas as fast as BYD is.
Geopolitical risk includes a pending 1260H designation. Strangely, BYD was added to the Pentagon’s Chinese military companies list in February 2026 – a list that was withdrawn just hours later. The Deputy Defense Secretary recommended BYD’s inclusion in October 2025, and that recommendation stands today. In time, the list may be published again, and BYD’s stock may take a hit. That would be a potential buying opportunity, as BYD has no Department of Defense/War exposure. Other stocks such as Tencent and CATL have bounced back from initial dips on 1260H inclusion.
As well, the EU is investigating subsidies for a Hungarian plant, and may yet cause trouble for BYD.
At ~HK$95/share, BYD’s ~$110 billion market capitalization is about 6.5x 2026 EV/EBITDA, 0.8x 2026 Revenue. BYD still shows net cash on the balance sheet despite the massive overseas spend.
Headline PE ratio is 17x 2026 earnings. Normalized R&D expense to the industry standard, the earnings ratio would be more like 13-14x. Top line growth is 9-10%, and may grow to 15% as investments come online.
Forward return on invested capital (ROIC) projects to 13-18% as those overseas factories kick in, but long-term auto businesses the last century have been terrible investments. They hang around well, but do not provide much return. I believe BYD is an exceptionally well-run and technologically advanced company today, and I believe long-term ROIC will settle above 10%.
BYD produced ~4.3 million cars in 2025, with over 1 million overseas, and operating leverage has really been ramping up since 2022. There will be years of improvement on that measure overseas.
BYD has ~29% more revenue than Tesla and ~1/12th the market cap. Tesla’s shareholders ask a lot of future robots. BYD sold 1.76 million battery electric vehicles (BEV) to Tesla’s 1.79 million.
I rate BYD a 7/10 at the current price. A rating of 7/10 is mild buy, small position, or wait for the 8/10 price, which is HK$75.
I would be an aggressive buyer at HK$75 or better, if the thesis still holds at that time. This implies a 10x normalized earnings multiple paired to a potential worst-case 10% long term ROIC. In addition to the investment case above and the excellent disclosure, that 10x/10% combination is potent in my experience, and leads to terrific upside, generally in the 15-20% annualized range. This would be because both the multiple and the ROIC overachieve in the future, if I have the investment thesis correct.
For a buy near the recent HK$95 price, if it were me I would shade the position light, say 4%, and leave room to double down aggressively to 8% if it gets to HK$75 and the thesis is still intact. BYD reports earnings later this month and releases its annual report. I will read it with interest.
Subscribe now
Haidilao International (6862 HK)
Founded by Zhang Yong in 1994 in Sichuan province, Haidilao is China’s only national hot pot chain. Hot pot is a staple in China and involves diners at each table cooking food in a communal pot of spicy hot broth. This spicy Chongqing/old Sichuan hot pot variation is the dominant hot pot today. Chongqing/old Sichuan peppercorn and a special fermented chili bean paste are the foundations for the characteristic flavor and spiciness.
Haidilao holds 2.2% of that market, almost three times the share of the nearest competitor at 0.8%. The secular growth runway for Haidilao’s offering is rather long. Haidilao is known for its service above all else. More on that later.
Haidilao International, the listed company is a Cayman Islands successor corporation founded in 2015. This Cayman Islands corporation is the full company, which owns all its subsidiaries. It is not to be confused with a VIE structure, which uses a Cayman holding company that is an empty shell, as was discussed in Part 1.
By buying the common stock 6862 HK in Hong Kong, one acquires pure common share ownership in China’s largest, and only national, hot pot chain, incorporated in the Cayman Islands.
Regarding structure, investors should know that the original predecessor company, Sichuan Haidilao Catering, grants Haidilao International royalty-free use of the brand, 海底撈, and is ~75% controlled by Haidilao International’s 70% owner and founder Zhang Yong.
海底撈 seems to mean “scooping from the bottom of the sea,” a phrase which fits hot pot rather well.
I can think of no reason why the founder, who controls ~70% of 6862 HK, would take the brand away from the operation. This structure existed long before the IPO, and is something of a vestigial tail. Harmless. I find nothing in this arrangement to worry about.
The Mistake?
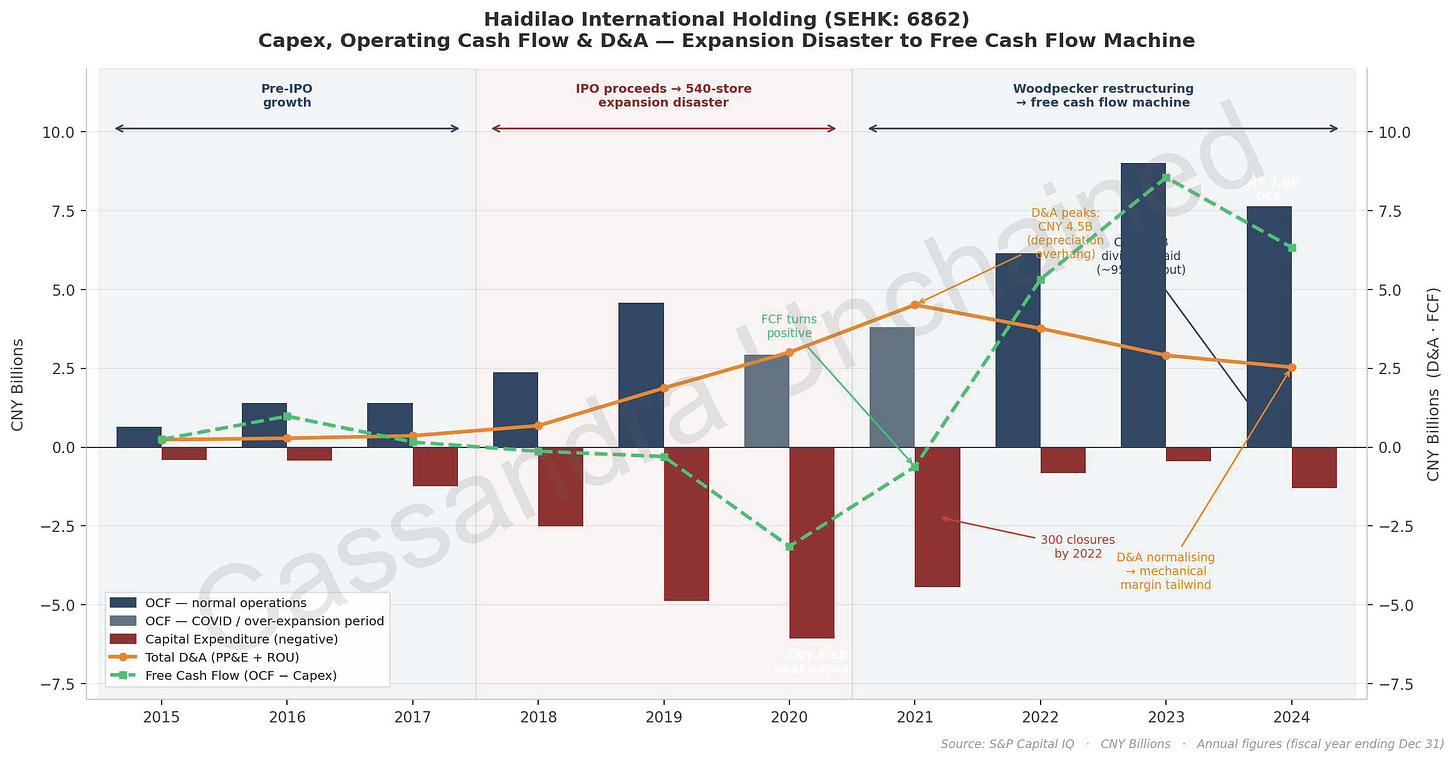
Haidilao International is a successful, good Chinese company that did a very bad thing. This chart take us through it.
[
](https://substackcdn.com/image/fetch/$s_!9Fek!,f_auto,q_auto:good,fl_progressive:steep/https%3A%2F%2Fsubstack-post-media.s3.amazonaws.com%2Fpublic%2Fimages%2F62d5ffc3-2a35-43dd-a624-3f9a9a623b6c_2324x1216.png)
2015-2017, Haidilao’s pre-IPO days were the picture of balanced, healthy growth. Free cash flow was invested back in the business.
2018, Haidilao IPO’d in Hong Kong, and management chucked the proceeds into a dramatic expansion, fatefully opening 540 restaurants during the first COVID year, 2020-2021.
Property, Plant & Equipment (PP&E) peaked at CNY 19.6 billion in December 2020.
By 2022, China was locking down hard, and Haidilao had written off 68% of its PP&E. Haidilao closed three hundred locations to stabilize the business. It was as much a dramatic mistake as it was catastrophic bad luck. It had ramped up to expand, and mistakenly kept the plan when COVID hit.
Also in 2022, Haidilao spun off its promising international operations as part of its restructuring. The spin-off, Super Hi, trades in Hong Kong with symbol 9658 HK.
Through 2023 and into 2024, the stock remained under pressure even as free cash flow ramped up fast and capital expenditures shrunk. For 2024, Haidilao generated ~$870 million in free cash flow despite a tough consumer spending environment.
During 2024, management paid out about 94% of its net income as a dividend to show confidence. At recent prices, that is about a 6% dividend yield, with no financial debt. Essentially every restaurant is leased, and Haidilao has termination options on most of them. This is how it was able to close hundreds of restaurants quickly.
2025 full year numbers are not out. We know that there was revenue pressure due to a weak Chinese consumer. On the other hand, food delivery wars of late may have given Haidilao a boost – more on that below.
Subscribe now
Top Hot Pot
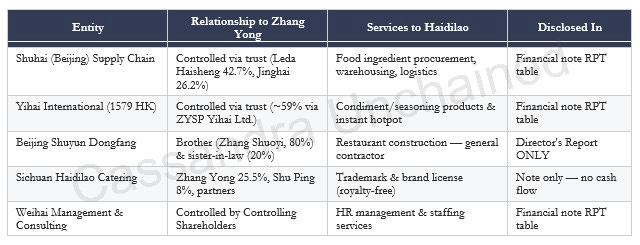
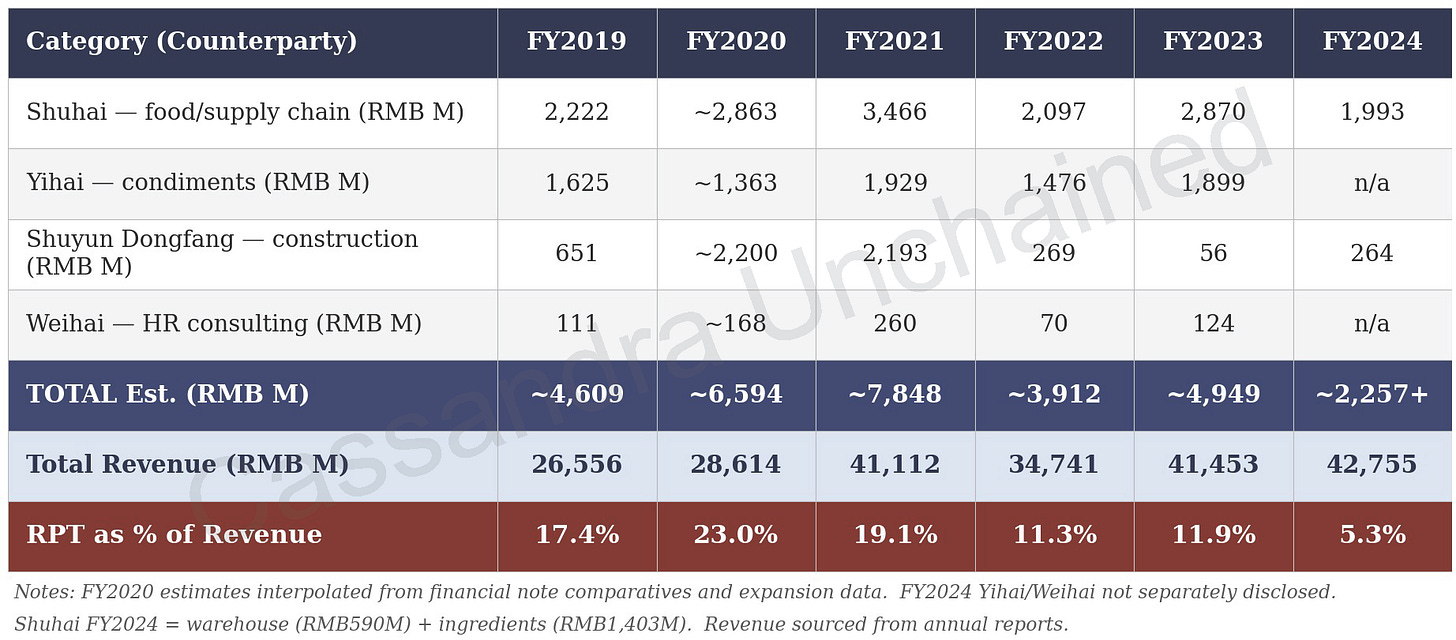
Haidilao’s operating business benefits from a rather Asian manner of vertical integration. A good part of Haidilao’s needs (construction, seasonings, logistics) are met by an ecosystem of sister companies linked to Haidilao’s founder. This amounts to ~40% of its costs through connected parties. Related-party transactions (RPTs) are of course typically a negative in securities analysis.
[
](https://substackcdn.com/image/fetch/$s_!4Fnx!,f_auto,q_auto:good,fl_progressive:steep/https%3A%2F%2Fsubstack-post-media.s3.amazonaws.com%2Fpublic%2Fimages%2Fd5a60e0e-199e-4e06-845e-05a4341f0329_640x245.png)
What is interesting here is the RPTs on balance seem to help Haidilao’s operating business. For example, Yihai International (1579 HK), the supplier of seasonings also controlled by Haidilao’s founder, has seen margins on its sales compress over time. That is not to say Yihai is suppressing its margins to help Haidilao, but it certainly does not appear to be gouging Haidilao. More on this in a bit.
China’s domestic market is full of counterfeit items and fake labeling, even in the food chain. One of JD.com’s competitive advantages, for example, is the wide array of trusted, authentic branded merchandise offered to customers. Haidilao similarly says this integration is the key to food safety, cheap construction costs, controlled logistics costs, etc.
Since the founder controls both sides, he could absolutely toggle margins one way or another. For now the data seems to advantage Haidilao. The founder controls ~70% of Haidilao shares, so even self-interest falls on Haidilao’s side. He owns, for instance, just ~35% of Yihai. It is also possible, one would hope, he is just being fair to both sides, which is a big advantage in China if the quality of the product is guaranteed.
Overall, these RPTs seem to give Haidilao a cost and quality advantage in some aspects, which can be important anywhere, but especially in China. It may even be necessary to scale.
Nevertheless, Haidilao’s big mistake – its doomed COVID buildout – benefited the founder’s brother’s construction firm Beijing Shuyun Dongfang. This is a private company with no public financial disclosure, and Shuyun Dongfang indeed built those 540 Haidilao restaurants very fast, receiving ~$620 million over 2020-2021, despite COVID and just before China’s lockdown.
Looking at other public competitors, the costs per restaurant seem roughly in line, which is heartening. The rushed nature of the expansion is suspect even so. An egregious grift, expensive mistake, or some parts of both.
Still, accounting for disclosed payments to related parties is good practice. In general, disclosure has been very good. The payments to the brother’s construction company, however, were not found with the others in the Annual Reports but rather in the Director’s Report. All such payments are collected in the table below.
[
](https://substackcdn.com/image/fetch/$s_!9Lqg!,f_auto,q_auto:good,fl_progressive:steep/https%3A%2F%2Fsubstack-post-media.s3.amazonaws.com%2Fpublic%2Fimages%2F194faa01-fca0-42c1-8513-9fa005453954_1844x811.png)
The cash flows to related parties as a percentage of revenue has come down significantly from the 2020-2021 restaurant buildout. The founder’s brother’s construction/logistics company received significantly less in following years. If this was a wayward grift, the restructuring and closing of restaurants self-corrected. Such would not excuse the grift, however, and this is something that hurts the valuation a bit and requires monitoring.
I will watch the 2025 annual report at the end of this month for more color, and whether there is a resumption of payment disclosure to Yihai and Wehai. 2024’s related party transactions as a percentage of revenue is likely still around 12%, or higher. I note that real services and goods are provided – the question is the pricing relative to an arms-length relationship.
Related party transaction are not automatically negative, but should be evaluated in an even-handed manner. In this case, I do not see evidence for abuse of shareholders in the disclosed payments and engagements with related parties. Companies like this – and there are a ton of them throughout Asian markets – must be broken down like I did above. Every payment and conflict identified. To monitor well, one must fully account for each in the first place.
The company makes a significant effort to train its employees for consistent, excellent service and table experiences across 1300 restaurants. Many Chinese restaurants do not prioritize service, so design of the environment and service can set a restaurant apart, and Haidilao seems to succeed at that. Haidilao is known in China for its standardized product and for its extra service – such as 24 hour service, servers tying hair back before you eat or wrapping your phone in plastic. Staff replace with fresh hot towels quickly. If waiting, there are free drinks and snacks, and even free manicures, shoe shines.
Haidilao in some respects is like mixing a luxury hotel with a hot pot restaurant. It seems to have worked, and become part of the customer goodwill/brand. Customer-first excellence in work culture in the restaurant business is often admired but rarely replicated.
The food delivery war on which Meituan, JD & Alibaba spent ~100 billion yuan (~$14 billion, about 30% of Meituan’s total annual revenue and ~3x JD’s annual profit!) for the privilege of destroying each other’s margins is actually beneficial to restaurants in general. Hot pot is 14% of restaurants in China. Daily delivery orders exploded from 100 million to 250 million. I will say it again, 250 million daily delivery orders. Wow.
When JD offered merchants zero commissions to recruit premium chains, Haidilao and Starbucks were named as targets. That means these companies acquired customers on JD’s dime. This is a reason for Haidilao rallying late last year – other restaurant chains rallied as well for this reason.
A Fudan University study found that delivery wars increase food delivery but at the expense of dine-in volume.
When the cannibalization of dine-in ends, Haidilao will likely have more customers writ large. Some, probably a good portion, will become dine-in customers. Haidilao still paid nothing for it.
Better, Haidilao, as a leading national restaurant, was particularly highlighted in advertisements placed by the delivery warriors.
In this regard, the national chains got the most expensive exposure all bought and paid for by the delivery companies and will therefore lengthen their lead on regional and smaller competitors. The coming annual report should shed a lot of light on how this dynamic is developing.
Subscribe now
Pot of Gold
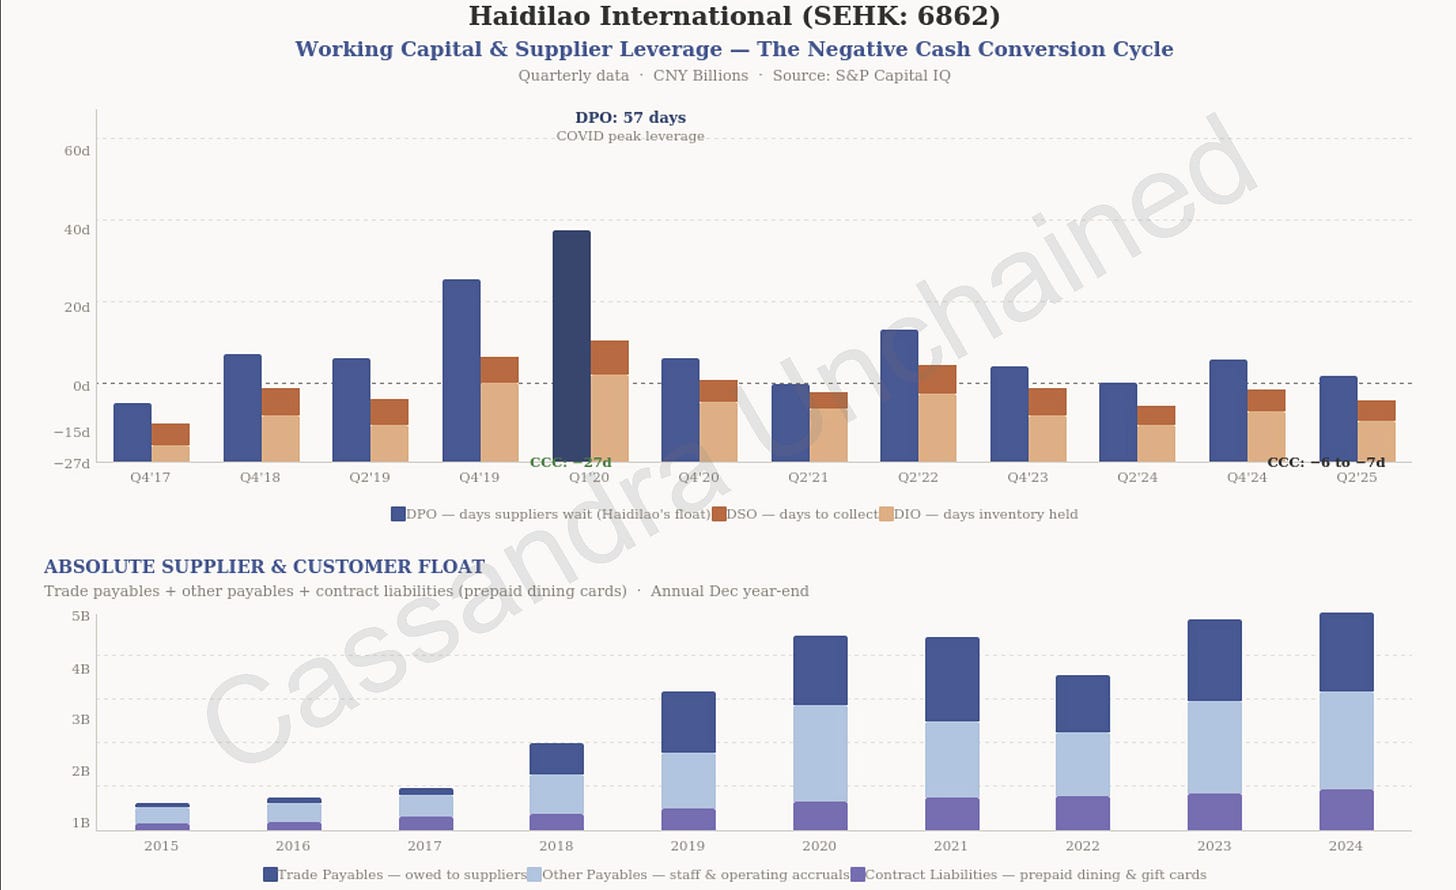
Haidilao gets paid up front but has significant payables to suppliers. During COVID, Haidilao expanded payables to a remarkable 57 days outstanding (DPO).
Could this be evidence that the founder uses the sister companies to help Haidilao? Yihai reports significant trade receivables from related parties. So the founder may not only toggle costs, but also cash flow, and in this regard, there is no evidence Haidilao is disadvantaged. Quite the opposite.
[
](https://substackcdn.com/image/fetch/$s_!muqd!,f_auto,q_auto:good,fl_progressive:steep/https%3A%2F%2Fsubstack-post-media.s3.amazonaws.com%2Fpublic%2Fimages%2F96037661-b1fb-4072-bfb9-accb42df5cda_2337x1428.png)
Haidilao collects cash and credit card payments from diners immediately, and fresh ingredients turn over quickly, so the company holds only 21 days of inventory while taking 37 days to pay suppliers. Note, 37 days is not abnormal or an abuse of its suppliers – it is within the standard 30-45 days. Yet the business model generates a permanently negative cash conversion cycle.
Yihai and other connected parties may not even be helping Haidilao that much. It may simply be in the business model that suppliers – and in fact customers – create significant float and finances the entirety of Haidilao’s operations. Whichever way one slices it, Haidilao gets a cash flow boost, and the RPT concerns are essentially moot.
With its ~11 billion renminbi cash, Haidilao’s cash and cash flows are in great shape.
[
](https://substackcdn.com/image/fetch/$s_!9hky!,f_auto,q_auto:good,fl_progressive:steep/https%3A%2F%2Fsubstack-post-media.s3.amazonaws.com%2Fpublic%2Fimages%2Ff3f583d4-1dfc-4a97-947a-7ea40ede4104_778x458.png)
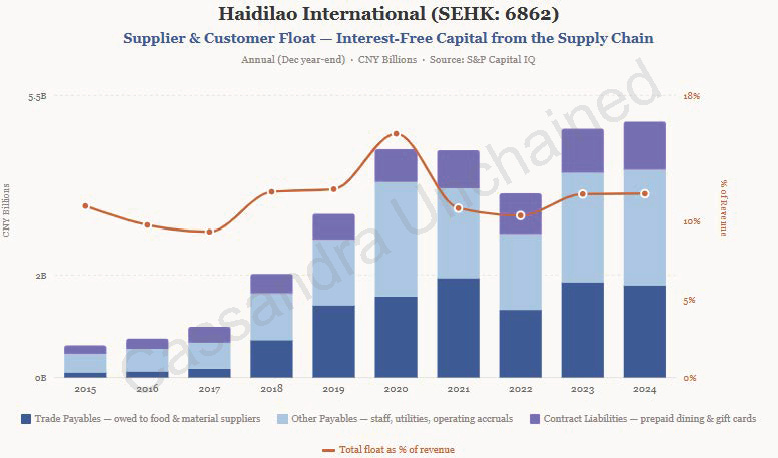
The chart above shows Haidilao has a float of CNY 5 billion – an interest free permanent pool of capital that stands at almost 12% of revenue. The float will continue to grow with Haidilao, as it is part of the business model.
Note, prepaid gift cards are 20% of the float, and this has tripled since 2017.
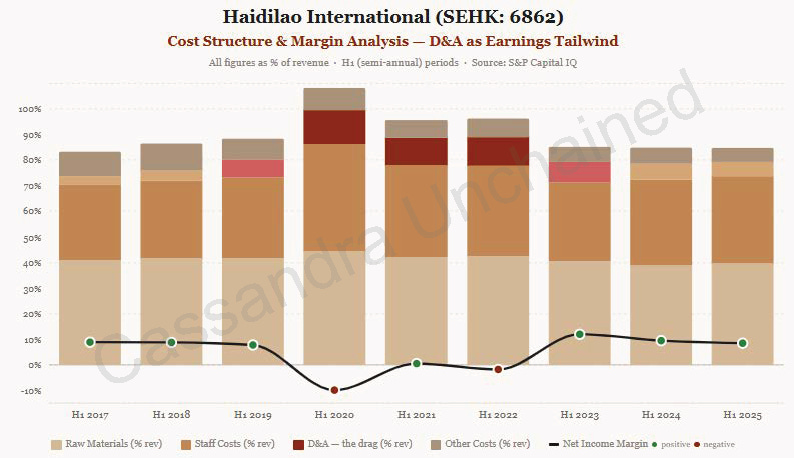
Another wrinkle is that earnings are suppressed by a temporary depreciation overhang from the fateful restaurant buildout and reversal. Margins are lifting mechanically as that mistake rolls off the balance sheet through the income statement year by year.
[
](https://substackcdn.com/image/fetch/$s_!QHdD!,f_auto,q_auto:good,fl_progressive:steep/https%3A%2F%2Fsubstack-post-media.s3.amazonaws.com%2Fpublic%2Fimages%2F8c07708b-5a96-46cf-bb9a-6458dd015a74_794x458.png)
The chart shows the earnings tailwind is already happening, and will continue for a few more years.
Haidilao has started franchising its brand. It did not announce this, but in 2024, and now this past year, a recurring line item for proceeds from franchisees appeared in its filings. This is an economic opportunity but also a risk to culture and quality. The controlled supply chain should help maintain consistency on those factors.
Both the upside and the main risk is Haidilao’s status as a pure play on the Chinese consumer. For all the reasons already discussed, this is a dead end Japanification or a long-term hope/expectation depending on one’s view. Revenue declined to low single digits last year. They will pay a dividend.
The market cap is about $11.7 billion, and it trades at about 18x earnings, while cash flow runs higher – operating cash flow thanks to the negative cash conversion cycle is a bit less than $1 billion, and free cash flow ~$870 million. Net income margins at 9-10% are back to pre-expansion levels.
I like the company as a Chinese consumer recovery play. It is also a natural non-VIE pure China play that may benefit in the event of a U.S. attack on VIE structures.
The stock has been strong lately with other non-VIE stocks, perhaps validating this strategy. The company and stock are under no security-specific sanctions risk.
I rate Haidilao 8/10 at the current price ~HK$17, which is a buy for a normal position, 5-6%, depending on liquidity mostly. I would add more at HK$15 and bring it to an 8-10% position at HK$13 or lower, if the thesis still holds at that time.
Haidilao reports at the end of the month, March 31st, and releases its 2025 Annual Report, inside of which the weak China consumer faces off against Delivery Wars.
Subscribe now
PDD Holdings (PDD, formerly Pinduoduo)
Long before Temu, ex-Googler Colin Huang launched PDD, a VIE structured e-commerce company, currently the highest margin e-commerce company in China, with a remarkable financing strategy so extreme that short sellers and long investors alike thought it might be fraudulent.
In 2015, Colin used Tencent’s ubiquitous messaging app to group buyers to get low prices on perishable agricultural products for resale. PDD lost a lot of money doing that, so in 2017, Colin abandoned the strategy and became a pure web platform company arranging drop shipping from farmers to buyers. This drove gross margins from -47% to +56% in 3 quarters. An almost unbelievable pivot, clearly evident in the financials.
PDD would receive the order, arrange the drop ship, and then not pay its farmer suppliers for 500-600 days. That is no typo. Colin had a brand new lightly capitalized money-losing company, but even so, his/PDD’s leverage over its mostly rural and industrial suppliers was stunningly bold.
Next, PDD added industrial suppliers to the Pinduoduo platform – and still, remarkably, maintained payables outstanding at 500-600 days. PDD earned substantial investment income on some RMB 420 billion (nearly $60 billion) in payments held back from merchants and instead invested in short-term instruments.
July 2018, PDD went public, listing an ADR on the NASDAQ.
November 2018, short seller Blue Orca examined two of PDD’s China-based VIEs and put out a report that alleged total revenue per these regulatory filings only amounted to RMB 1.246 billion while PDD’s SEC prospectus reported revenues at RMB 1.951 billion, a potential 57% overstatement. Blue Orca also alleged the operating losses shown in PDD’s SAIC filing were 65% greater than losses filed with the SEC.
The payables float likely explains this. PDD apparently ran its cash inflows through a payment processor entity/VIE into restricted accounts for distribution to merchants 500+ days later. The cash holdings of PDD during Q2 2018 – the quarter Blue Orca examined – were an incredible 7x that quarter’s revenue, and were likely earning enough investment revenue and income to fill the gaps identified by Blue Orca.
The stock jumped 12% the day the short report came out. Perhaps investors saw the short report, investigated themselves, correctly identified the three VIEs or two VIEs and the payments processor, and were impressed. SAIC reports are no longer available for review by investors, so I cannot analyze those at this time.
Speaking of analysis, Blue Orca was not wrong to sniff around. PDD’s disclosure is subpar at best. PDD reports revenue with no breakdown – no country or segment details. The last period PDD reported segment revenue numbers was Q2 of 2018 – two, Merchandise Sales and Online Marketplace Sales. A “Transaction Services” line showed up only in 2019 and revealed 822.9 million renminbi revenue – this was likely the payment processor VIE. Ever since, no further information on revenue mix.
Hark back to Jack Ma’s single-handed transfer of Alipay’s assets from Alibaba’s VIE. PDD’s ephemeral disclosure tells me that “Transaction Services” is likely a particularly important part of PDD. It may process the income on the payables float. In the dark, in a poorly disclosed VIE perhaps, in Beijing.
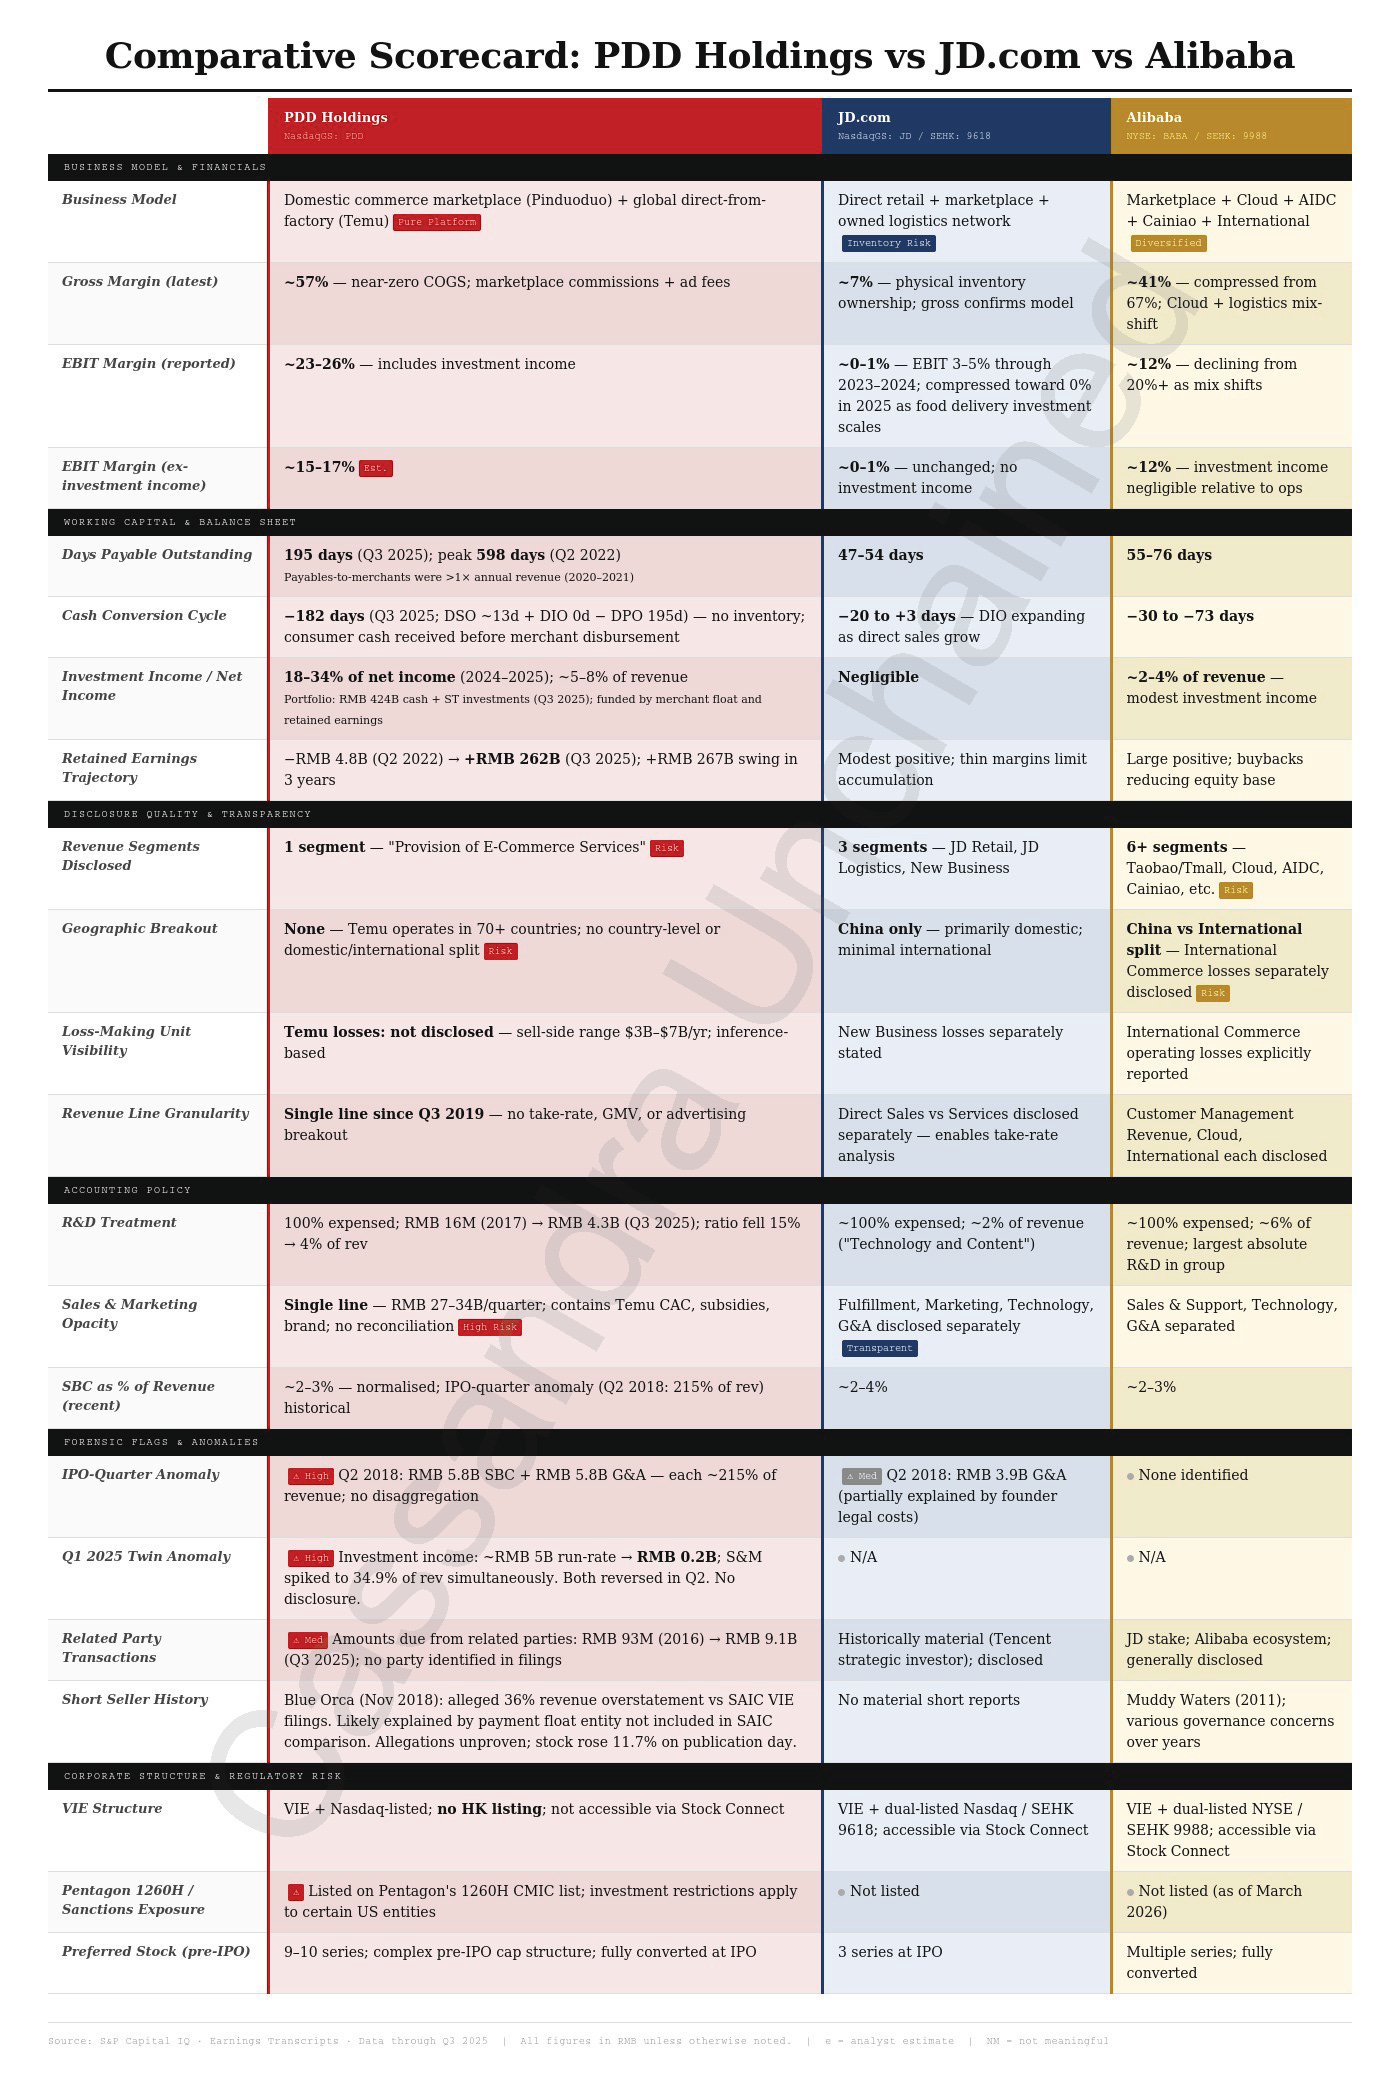
When facing quirks in disclosure, it is important to do a comparative forensic analysis against similar companies. I do this by first reviewing PDD for red flags, then checking comps for those same issues. The table below summarizes this analysis for PDD, with JD.com and Alibaba as the comps.
[
](https://substackcdn.com/image/fetch/$s_!hxUf!,f_auto,q_auto:good,fl_progressive:steep/https%3A%2F%2Fsubstack-post-media.s3.amazonaws.com%2Fpublic%2Fimages%2Fccf49fb4-e65a-4ca4-951d-4730f281ea0e_1400x2095.png)
Per the table above, I cannot plant a Red Flag in the ground and proclaim fraud. Blue Orca likely did not examine one of three VIEs, or overlooked the payments processing arm as a source of revenue and cash flow. Nothing else in my comparative forensic analysis rises to an allegation of fraud. Rather, poor disclosure.
PDD’s problem with disclosure is vexing. Its unorthodox bootstrapped success almost seems to have been too exponential for adequate disclosure, if that is even possible. I hope this is not a reflection on the adequacy of internal controls.
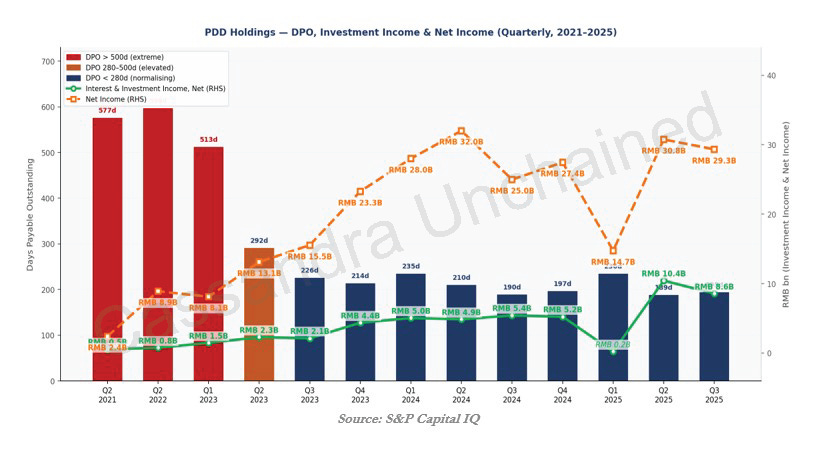
The chart below shows interest income on payables outstanding was, as late as Q2 2021, the sum total of PDD’s profit. The pre-Temu payables float is epic.
[
](https://substackcdn.com/image/fetch/$s_!h8YU!,f_auto,q_auto:good,fl_progressive:steep/https%3A%2F%2Fsubstack-post-media.s3.amazonaws.com%2Fpublic%2Fimages%2F7f975d1a-c8f5-4b14-8942-c6c6f766560b_813x451.png)
Colin resigned from PDD completely in 2021, and September of 2022, PDD launched Temu, an international consumer-focused white-label drop-shipping business. With Temu’s launce, days payable immediately came down substantially before stabilizing from Q3 2023 through to today at what remains a significantly high level. By 2024, Temu was the most downloaded shopping app in the United States and operated in 70 countries.
Revenue grew in the 100% range into early 2024.
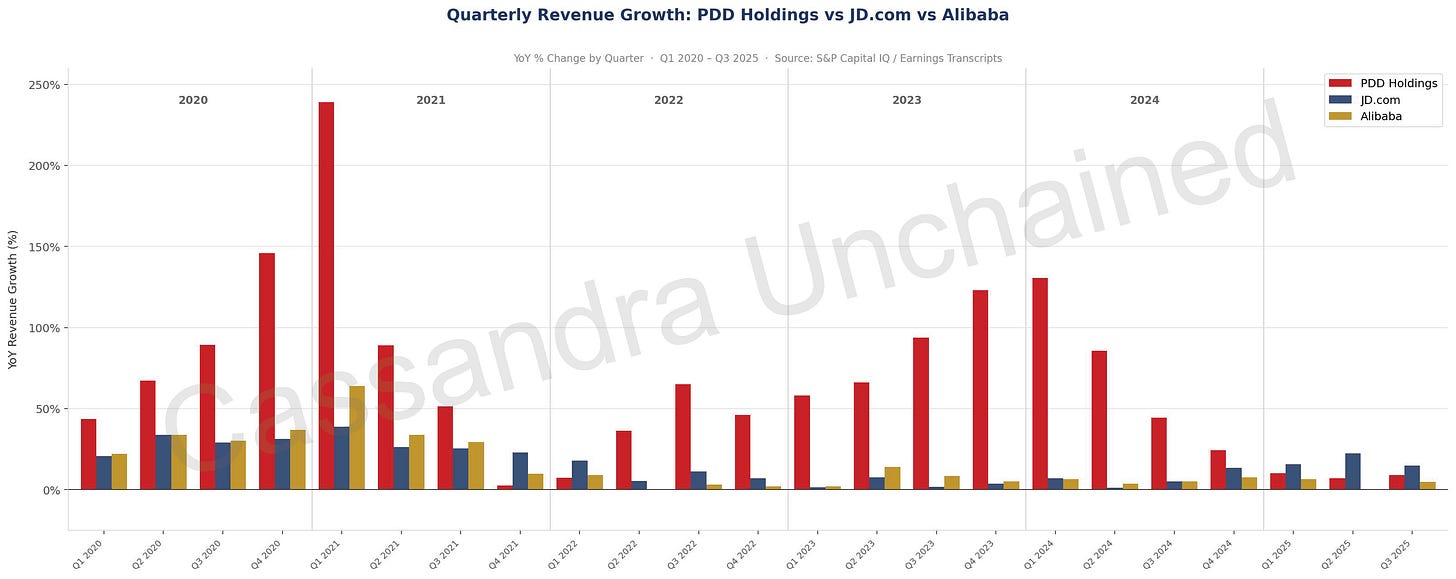
Then competition fought back. JD.com took its marketplace merchant count up 200%, and Alibaba launched Taobao Deals in tertiary markets that had been PDD’s owned territory.
[
](https://substackcdn.com/image/fetch/$s_!Sp8x!,f_auto,q_auto:good,fl_progressive:steep/https%3A%2F%2Fsubstack-post-media.s3.amazonaws.com%2Fpublic%2Fimages%2F2d0df863-09d0-4b14-bc1d-cffbccb862d0_3221x1281.png)
The chart above tracks the twin towers of PDD’s revenue growth, first Pinduoduo domestically then Temu internationally. The troubles of course were not limited to competition in China.
The U.S. in 2025 eliminated a de minimus loophole Temu had used to ship without tariff into the U.S.. Temu pivoted to shipping bulk to U.S. based warehouses, but Temu’s cheap limitless SKU advantage over Walmart and Amazon evaporated. These two had extensive physical logistics expertise that Temu simply does not have.
PDD barely grew EPS in 2025 on ~23% revenue growth, as margins took a hit. Gross margins peaked at 75% in 2022 but have fallen to the mid 50% range.
PDD however is not going away, not yet. The Wall Street outlook for 2026 is unclear – the expectation is revenue growth continues to fall in the face of competition (to ~10-15%), and earnings will potentially track that growth, but only if PDD can keep margins from compressing more. PDD’s gross margins are about 20 points lower than 2022’s 75% level.
I am not optimistic PDD’s earnings growth will hit double digits in 2026. I would acknowledge some value resides in the probability of Founder Colin Huang doing something impossibly great again. But he has not been involved as CEO or Chairman since 2021.
So, PDD has a $155 billion market cap, and $48B of cash – though we know it owes merchants a bit over $30 billion. So free cash is ~$15 billion, and the float is ~$33 billion. Float has grown as PDD has grown, and this appears likely to continue. How and where this float is invested is not disclosed.
PDD is making ~1 of every 3 dollars of net income on the $33 billion of float plus free cash plus an investment portfolio, all totaling to near $60 billion. This is not internally consistent. Short-term interest rates of 1-1.5% in China. PDD filings cite the use of “fair value assets” which implies assets producing capital gains rather than simple interest. This investment income is real, I believe, but is likely to be more lumpy and opaque than a simple bank deposit would be. Perhaps not as liquid as well. PDD of course does not disclose how it makes that $4.9 billion in investment income - out of $14.8 billion total income for the trailing twelve months as of 3Q2025. Dang disclosure.
This is why the company trades apparently cheap. Disclosure. New management did not change the poor level of disclosure. I have a feeling it is all on the up and up, but I cannot get confident about that.
A Hong Kong listing looks likely soon given a recent auditor shift. PDD switched its auditor from the Beijing Ernst & Young office to Ernst & Young HK. This shift is effective for the 2025 fiscal year. Ernst & Young HK brings PDD’s financials and documents out of the PRC such that U.S. regulators can more easily inspect them.
Significantly, a Hong Kong listing, would allow Southbound investors, through StockConnect, to invest in PDD finally. These flows might potentially add another pillar of demand for the stock. I look forward to evaluating the degree to which mainland Chinese support PDD by purchasing its stock.
PDD is on the Pentagon’s 1260H list, which puts it on the radar for sanctions but means little in itself. This seems mostly a negotiating tactic for the U.S. when engaging China diplomatically.
I plan to look at PDD again at the time of the Hong Kong listing. Because of the poor disclosure, especially with respect to revenue components, Temu’s competitive and regulatory headwinds hit harder. I hope the HK listing and the new auditor in HK bring additional disclosure.
I rate PDD 6/10.
I do not have a buy target price on PDD at this time. If I thought a position in PDD was worthwhile at this price, it could not be a full position due to the disclosure issue. I would keep it around 2%, roughly 1/3 of my typical full position, until disclosure is satisfying to me.
By tackling BYD, then Haidilao, and now PDD, I proceeded from best disclosure to disclosure of significant related party dealings and now to very poor disclosure. The middle one is my current favorite of the three for many reasons. One of those reasons is that hiding white collar shenanigans is worse than allowing investors to consider said shenanigans within the context of the total analysis.
PDD is expected to report earnings March 19th, and I will re-evaluate at that time. I will stay on top of this one, and look forward to the annual report shortly after earnings are released.
Subscribe now
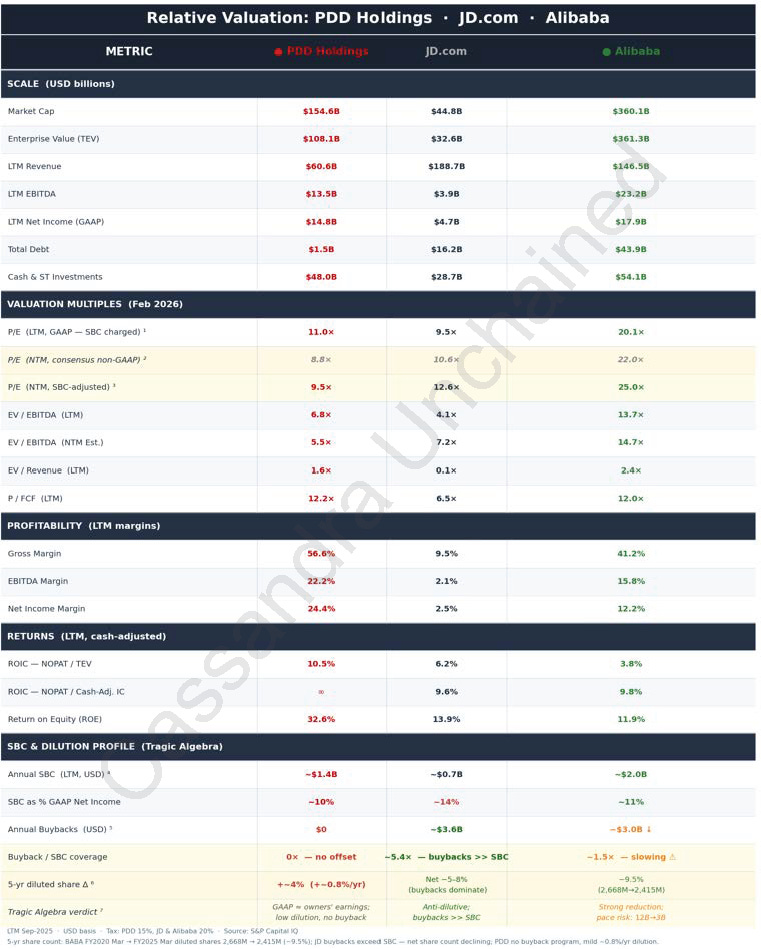
PDD, JD.com & Alibaba: Valuation Metrics
The PDD Holdings analysis above cannot offer proper perspective without a quick comparative valuation look at the three companies that dominate e-commerce in China.
[
](https://substackcdn.com/image/fetch/$s_!u4Ra!,f_auto,q_auto:good,fl_progressive:steep/https%3A%2F%2Fsubstack-post-media.s3.amazonaws.com%2Fpublic%2Fimages%2Ff719484a-11d3-4a0a-a250-9d6406f34a76_761x949.png)
There at the bottom, the table above references the Foundations: The Tragic Algebra of Stock-Based Compensation post, which is worth a read when evaluating these companies.
From the top, consider the scale. All are now major companies with JD.com and Alibaba both having more than $100 billion worth of revenue, and PDD Holdings no slouch at $60 billion.
The businesses could not be more different, and profitability, the margins of each, drives that home.
All are excellent businesses from a Return on Invested Capital perspective if one keeps in mind the Chinese consumer is saving, saving, saving.
[
](https://substackcdn.com/image/fetch/$s_!jYnT!,f_auto,q_auto:good,fl_progressive:steep/https%3A%2F%2Fsubstack-post-media.s3.amazonaws.com%2Fpublic%2Fimages%2Feae39e74-a5f9-4881-9491-c9b53b4f87b6_833x599.png)
When consumer sentiment improves, spending should follow. ROIC and profitability should explode for all three. Current adjusted ROIC ~10% at a Great Depression-like trough is not so bad at all.
PDD’s cash is, as explained above, comprised of about $33 billion float and $15 billion free cash. But despite the stock’s severe fall, there have been no share buybacks. This gets to PDD’s opacity – as the cash will continue accumulating, the use of it is a real question.
PDD may be the best business of the three, but that judgment will have to wait. I already know it has the worst disclosure.
Scorecard
As for the 500-word bullet target for the companies covered herein, I missed, and the reader has my apologies. In consequence, I also overpromised about the full content of this note. The information presented in this post is perhaps a decent sequel to the first, but clearly no finale.
Part 3 of Hong Kong Stocks: Structure & Strategy series will cover Alibaba, JD, and Meituan. Those three companies make a good trio for a well-bridged analysis of the “Delivery Wars.” Part 3 will also cover other companies mentioned in Part 1, including Tencent, and maybe a few others.
To conclude the series, I will construct and explain my ideal “hedged” all-long Hong Kong portfolio.
I hope you learned something!
Until Next Time!
Cassandra Unchained is a reader-supported publication. To receive new posts and support my work, consider becoming a free or paid subscriber.
这是第一次在文末为读者提供一份更短、更紧凑的主文摘要。今后将沿用这一格式。摘要一般控制在约 1500 词以内,通常最多配 1–2 张图,并按《纽约时报》标准阅读难度撰写。
跳转到摘要
感谢所有订阅者就如何改进 Cassandra Unchained 提供的宝贵反馈。
立即订阅
于是,《港股:结构与策略》系列的第二篇文章开始了。我强烈建议在继续阅读之前先读第一篇:VIE:脆弱性、优点与价值。
这些公司看似被许多人“懂个大概”,但真正理解的人似乎寥寥无几。
除了 VIE,这些股票还有另一个必须理解的共同“缺陷”(或“特性”)。要理解它,离不开图表。
如第一部分所述,腾讯是 2000 年代中期走出来的最优秀股票之一:股价一路复利至今,年化约 35%。但近一段时间的体验就没那么令人兴奋了。腾讯股价自 2020 年 11 月以来基本持平。
[
](https://substackcdn.com/image/fetch/$s_!JZ9c!,f_auto,q_auto:good,fl_progressive:steep/https%3A%2F%2Fsubstack-post-media.s3.amazonaws.com%2Fpublic%2Fimages%2F92c5a859-4bfc-4800-890c-e4b3395dd319_1804x1283.png)
这并不罕见。百度于 2005 年 8 月 5 日在纳斯达克 IPO,约比腾讯在香港上市晚一年。当时很多人把它视为“中国的 Google”——那时 Google 也还很年轻。百度从 IPO 到 2018 年有一段惊人的上涨,年化复利约 20%。2021 年初的狂热行情里,百度也出现过一波短暂的、由梗文化推动的复苏式脉冲上涨,但百度今天的股价,和 2010 年差不多。
[
](https://substackcdn.com/image/fetch/$s_!cARa!,f_auto,q_auto:good,fl_progressive:steep/https%3A%2F%2Fsubstack-post-media.s3.amazonaws.com%2Fpublic%2Fimages%2F11b281a1-713b-46aa-96ba-72873144848f_1805x1293.png)
阿里巴巴直到 2014 年才上市。少了 2000 年代中期那段起跑优势,阿里巴巴的年化回报只有 4%。在 2024 年的低点,阿里股价一度跌到低于十年前 IPO 价格的位置,如今则交易在 2017 年左右的水平。
[
](https://substackcdn.com/image/fetch/$s_!lM5R!,f_auto,q_auto:good,fl_progressive:steep/https%3A%2F%2Fsubstack-post-media.s3.amazonaws.com%2Fpublic%2Fimages%2Ff1685074-c119-45df-b80b-dced694eba08_1798x1262.png)
京东也在 2014 年上市。自 IPO 以来,股价复利年化也只有 4%,距离历史最低位并不远。
[
](https://substackcdn.com/image/fetch/$s_!7fnJ!,f_auto,q_auto:good,fl_progressive:steep/https%3A%2F%2Fsubstack-post-media.s3.amazonaws.com%2Fpublic%2Fimages%2Fac2d0a25-6ed2-4ff8-b365-2685255e8a7e_1798x1276.png)
Trip.com(携程),一家中国在线旅行社,早在 2003 年就以 Ctrip.com 的名义在纳斯达克上市,甚至比腾讯还早一点。自 2003 年 IPO 以来,Trip.com 股价年化复利 19.0%。我们都知道,COVID 给旅游行业带来了显著的波动。
[
](https://substackcdn.com/image/fetch/$s_!cGVN!,f_auto,q_auto:good,fl_progressive:steep/https%3A%2F%2Fsubstack-post-media.s3.amazonaws.com%2Fpublic%2Fimages%2F9466bf60-71b3-4d86-bb41-2adf48880a67_1075x978.png)
快手是排名第 2 的视频社交媒体公司,但直到 2021 年才上市。起步不顺,快手下跌 78%,年化回报为 负 26%。
[
](https://substackcdn.com/image/fetch/$s_!Gyrp!,f_auto,q_auto:good,fl_progressive:steep/https%3A%2F%2Fsubstack-post-media.s3.amazonaws.com%2Fpublic%2Fimages%2F4c5cea2a-1279-425f-b5b9-e0311c818205_1803x1285.png)
美团,中国占主导地位的外卖及其他配送公司,于 2018 年上市。美团股价较 2021 年高点下跌约 80%,而自 IPO 以来年化复利也仅约 5.5%。
[
](https://substackcdn.com/image/fetch/$s_!aJvh!,f_auto,q_auto:good,fl_progressive:steep/https%3A%2F%2Fsubstack-post-media.s3.amazonaws.com%2Fpublic%2Fimages%2Fe633b512-8c78-4462-b61a-ec620beb82a1_1802x1269.png)
海底捞较 2018 年 IPO 价格低约 7%,较 2021 年高点下跌 81%。COVID 封控重创中国餐饮业,而此后消费支出一直偏谨慎。
[
](https://substackcdn.com/image/fetch/$s_!dVst!,f_auto,q_auto:good,fl_progressive:steep/https%3A%2F%2Fsubstack-post-media.s3.amazonaws.com%2Fpublic%2Fimages%2Fcf4139b2-bdbb-409e-8e35-460e4d23a020_1807x1283.png)
那么,这里到底发生了什么?
那条绿线是营收。再看一遍每张图。表现惨淡的原因,没有任何一个是因为生意不行。恰恰相反。几乎所有案例里,营收都以非常健康的速度持续增长。对多数公司而言,这种营收增长甚至穿越了 COVID,以及可怕的中国封控。
2021 年发生了什么?为什么这些股票此后一直承压?
不幸的是,解释是多因素的。所以,列个清单。
2020 年 10 月,阿里巴巴创始人马云批评中国政府扼杀创新。几天之内,阿里旗下金融部门蚂蚁集团的 IPO 被叫停。由此开启了为期两年的监管整治,重点针对大型科技公司,范围涵盖游戏(腾讯)、教育科技(对一批想上市的教育公司不允许使用 VIE)、外卖、电商,以及网约车(滴滴)。北京的愤怒月复一月、年复一年地宣泄——尽管最近已有所变化。
2021 年 11 月,是全球泡沫破裂的月份。NFT、加密货币、手表、梗股、SPAC,你能想到的都在跌。港股对这场狂欢参与不深,但在全球风险偏好骤降时仍然脆弱。美国及其他国家的股市在 2022 年见底时,中国的封控才刚刚开始。
仅中国房地产市场的崩盘就足以制造中国版的 GFC(全球金融危机),但在某些方面甚至更糟。房地产部门在顶峰时占中国 GDP 的 30%,占地方政府收入的 40%,占居民资产的 2/3——全部都远高于美国在 GFC 之前的水平。房产几乎是中国整个城市人口的储蓄/投资账户。2020 年 8 月,北京对房企的杠杆比例设定上限以抑制投机。结果,这一监管行动反而暴露出房地产部门债务的庞氏结构。恒大负债 3350 亿美元,约为其年收入的 3 倍。此后数年内,恒大及 50+ 其他开发商相继倒下。家庭财富损失估计为 5–10 万亿美元。在美国都难以想象这么多钱的蒸发,更别说在中国。事实上,在美国同一时期,政府却在向民众发放 5–10 万亿美元的可豁免贷款、刺激支票和其他“赠与”。
中国的 COVID Zero(动态清零)政策带来了其他国家都难以想象的封控。很多噩梦般的场景被手机拍下并上传到网上。整治/封控发生在 2022 年,比一些国家更晚,却与上面描述的几乎所有问题同时发生。青少年自杀率翻倍。2022 年 4 月,零售额下降 11%,工业生产崩塌。永久性损伤包括白领和公务人员的大幅降薪。这使本已偏高的储蓄率进一步飙升——2022 年居民储蓄较 2021 年暴增 81%,直接从消费中“偷走”了需求。随后,当中国放松封控时,中国仍然经历了一场急性 COVID 大流行。数以亿计的中国人感染 COVID,医院挤兑成为又一场令人难忘的噩梦,持续压制国内情绪,使消费者选择储蓄而非消费。
中国持续在南海欺凌他国,而入侵台湾的风险沉沉压在外国投资者心头;他们担心一旦中国发动攻击,可能遭遇制裁。正如第一部分所讨论的,Polymarket 仍预测到 2030 年前入侵的概率为 30%。
因此,中国股市的受损程度更深、持续时间更长,甚至超过了美国的 GFC。事实上,上面多数股价走势图看起来像 1929 年之后的美国股票——在低点时跌幅 80% 甚至更大。
但同样的图表也显示,几乎每家大公司的销售额都在增长。或许这意味着:尽管看起来像一场彻底的“完美风暴”,中国的经济数据并不像许多人说的那样夸大,或者也不像他们说的那样糟糕。
重大熊市最主要的历史成因,是估值倍数压缩——市盈率(PE)、EV/EBITDA 或 EV/Sales 等倍数的崩塌。在当前熊市中,香港市场的倍数压缩程度,堪称发达市场历史上最惨烈的一类。
下面比较 1900 年至今主要指数熊市中的倍数压缩。请耐心点。下方对比图使用的是滚动市盈率(trailing PE)。
[
](https://substackcdn.com/image/fetch/$s_!GRQW!,f_auto,q_auto:good,fl_progressive:steep/https%3A%2F%2Fsubstack-post-media.s3.amazonaws.com%2Fpublic%2Fimages%2F785237e5-53a7-4c13-a379-1e7cacbb14c5_1080x961.png)
比较崩盘很难,尤其跨越很长的时间跨度。在这张图里,纳斯达克科技泡沫破裂是史上最惨,因为起点的 PE 极高。总体而言,这张图揭示:最严重的倍数压缩往往起始于更高的 PE。恒生科技指数当时也在那一档——不久前才发生的非理性繁荣。
下面我将展示另一张图,这次使用的是席勒周期调整市盈率(Shiller Cyclically Adjusted PE,CAPE)来衡量美国各指数。席勒方法更适合跨数十年的比较,而关于美国重大股灾的优质数据横跨一百多年。
席勒 CAPE 数据适用于标普 500 及其历史类比指数。因此,在下图中,1929 年大崩盘的道琼斯工业指数被一个标普 500 的类比指数所替代。图表也用标普 500 替代了 2000 年互联网泡沫破裂时的纳斯达克综合指数。标普 500 本就波动更小,而席勒方法更是如此。
注意,我在这里说“互联网泡沫”,但正如我在 泡沫的核心信号:供给侧的饕餮 一文中所述,2000 年纳斯达克崩盘远不止“互联网”。投机性疯狂涵盖了对数据传输的史诗级过度投资,而正是这一点使得泡沫破裂的冲击持续更久。
[
](https://substackcdn.com/image/fetch/$s_!JoKo!,f_auto,q_auto:good,fl_progressive:steep/https%3A%2F%2Fsubstack-post-media.s3.amazonaws.com%2Fpublic%2Fimages%2F4194bc4a-3a67-4d52-ba54-1c02d040936f_1080x1175.png)
这很有意思。对美国主要熊市做同样的研究时,如果用席勒 CAPE 方法,而不是滚动市盈率,那么1929 年大崩盘(此处以标普 500 的类比指数代表)就回到了它在我们集体制度记忆中所占据的位置——第一名。
在这一方法下,恒生科技指数的崩盘仍然排在第 2。
立即订阅
下面是本研究的最后一张图,这里我把两种方法结合起来。纳斯达克互联网泡沫破裂和道琼斯 1929 年大崩盘都回来了,二者均用滚动市盈率计算。CAPE 方法仍然保留,此外还加入了 1990 年代日经崩盘以及 1970 年代英国 FT All-Share 崩盘的席勒 CAPE 研究结果。
[
](https://substackcdn.com/image/fetch/$s_!Aguj!,f_auto,q_auto:good,fl_progressive:steep/https%3A%2F%2Fsubstack-post-media.s3.amazonaws.com%2Fpublic%2Fimages%2Fdc4c59d6-a061-4a1c-af03-4e0566a8fc4c_1080x1653.png)
研究熊市历史的人,希望会觉得上述崩盘并置很有意思。纳斯达克在 2000–2002 年的下跌排名第一,取代了 CAPE 版本的道琼斯 1929 年大崩盘(同样以标普 500 类比指数代表)的第一名位置。
恒生科技指数的下滑如今已进入第 5 个年头,在本次熊市倍数压缩研究的各种口径下,排名第二或第三。
说到并置,下方的汇总表把这一切的要点说明得更直观。注意右侧那根孤零零的绿色柱子。
[
](https://substackcdn.com/image/fetch/$s_!TuhY!,f_auto,q_auto:good,fl_progressive:steep/https%3A%2F%2Fsubstack-post-media.s3.amazonaws.com%2Fpublic%2Fimages%2F8fc541e5-5265-40e5-ba09-ba9948d4f28f_1747x911.png)
在所研究的 11 次主要熊市中,恒生科技指数是唯一一个在股市崩盘期间仍然实现盈利增长的。
恒生指数——不同于恒生科技指数——在每一种方法下也都位列史上最严重熊市之列。该指数权重较重地集中于金融、地产以及前国企。其 PE 压缩起点更低——滚动市盈率从 16 压到 7——并且并不令人意外地(对我而言)与 1929 年道琼斯工业指数崩盘相当接近。
在有记录的市场历史中,没有任何其他主要指数、任何其他主要熊市曾出现其成分股盈利在崩盘期间仍然增长。因此,恒生科技指数的崩盘完全由倍数压缩导致,即估值与情绪压缩。
当然,恒生系列指数也是目前唯一仍在延续的主要熊市。这一切都要求我们对香港股票做一场硬核、法证式的审视。
这些深挖将比我最初设想的更深入。对每家公司而言,完整图景包括它是否为 VIE,而这背后的含义也值得重新温习。
VIE 结构回顾
我此前评估过港股相对美国科技与消费股的相对价值,并解释了常被引用为“不投资港股理由”的 VIE 所有权结构的风险与现实。
简要回顾:我之所以愿意投资香港,有多方面原因,其中之一是中国内地投资者在 VIE 结构的港股中投入了 2000+ 亿美元。
此外,VIE 结构是整个公司的真正结构,并不存在另一套独立的“真实”或“正宗”股份。即便对内地投资者而言,这些大型公司的所有股份,也都是开曼离岸控股公司中的股份;这家开曼公司是通往所有权的唯一门户。
这些公司是中国最大的科技与媒体公司,北京若要对它们下手而不引发中国社会的绝对混乱,几乎不可能。达摩克利斯之剑仍然挂在北京腰间——但在鞘中。
最后,美国采取行动反制 VIE 的概率远高于中国,但美国也无法触及 VIE 的价值。除开曼离岸控股公司之外,结构的其余部分(包括 VIE)都注册在中国境内。我的详细逻辑见 VIE:脆弱性、优点与价值。
那么,开始吧。
立即订阅
BYD (1211 HK)
BYD(比亚迪)是一家立足中国、并在国际上快速扩张的主导性电动车(EV)与电池制造商,它不使用 VIE 结构。由于 BYD 不在受限制行业,股东直接持有普通股。BYD 的普通股在香港与内地两地交易,投票权与分红权完全一致。香港的股份称为 H 股,内地的股份称为 A 股。
创始人王传福持股约 17%,创始团队合计约 30%。这些股份与我或你可以买到的,完全是同一种股份。伯克希尔·哈撒韦在持有 BYD 十余年后获得了很好的回报,但已在一段时间前卖出最后的股份。
凭借大规模的垂直整合模式,BYD 可能是全球最低成本的整车制造商之一。BYD 控制供应链,在每一步都能省下利润空间:芯片、电池、车身、电机等等都自己做。
BYD 的半导体业务并不限于供应汽车公司。百度、小米、华为是其客户,工业企业、新能源企业、家电企业也在其客户之列。
电池创新
BYD 的刀片电池(Blade battery)是前沿的磷酸铁锂(LFP)体系电池。LFP 电池化学稳定,在热失控压力下不易释放氧气,因此不像镍锰钴(NMC)电池那样容易发生连锁式燃烧。LFP 电池也便宜约 30%,且更安全,但每公斤能量密度比 NMC 低约 30–40%。
在数百万辆车的规模上,这是一项显著的成本优势。不过,如果 NMC 每公斤能量高出 50–75%,NMC 看起来似乎更“值”。特斯拉及其他厂商历史上确实更多使用 NMC。
BYD 的刀片系统通过取消模组的重量与体积来补偿差距。其创新做法是把长条扁平电芯滑入一个电池包中,并让该电池包成为底盘的结构件之一。BYD 称,这能使体积/能量效率提升 >50%。
宁德时代(CATL)是直接的电池竞争对手。它拥有一套 NMC 电池系统,当与为其设计的底盘匹配时,可实现 72% 的体积利用率与 255Wh/kg 的能量密度。这些数据均来自 CATL,但看起来对比 BYD 的 LFP 新刀片系统(66% 与 200Wh/kg)更有优势。
CATL 掌握全球电动车电池份额的不到 45%,是一家纯粹的第三方供应商,同时生产 LFP 与 NMC 两种体系。
BYD 自第一天起就围绕刀片系统进行平台设计,这可与特斯拉自第一天起围绕 CATL 的电池系统进行平台设计相类比;但特斯拉是客户,会在供应合同谈判中把利润空间压走。
BYD 不仅把这部分利润留下,还将刀片电池(品牌为 FinDreams)销售给丰田、特斯拉(用于其 Megapack 储能)、小米、BorgWarner、LG 等众多客户。BYD 以标准化产品供应这些客户,除尺寸变体外几乎不做有意义的定制。
电芯与车身/底盘一体化——BYD 仅保留给自家车型——最小化了 LFP 与 NMC 的能量差距,形成 BYD 的成本与性能优势,同时使用 LFP 相对 NMC 也保留了安全优势。
事实上,特斯拉的标准续航版 Model 3 和 Y 使用的是 LFP,而非 NMC,其中一部分原因是 BYD 通过电芯到电池包(cell-to-pack)架构创新使 LFP 得到“正名”,并推动行业向这一方向转变。这是一场从 NMC 走向 LFP 的全球迁移。
CATL 仍是主导供应商。我之后会更详细地研究 CATL (3750 HK),但先提一句:它在 2025 年 5 月于香港上市,如今交易在约 40 倍盈利、>5 倍销售额。先记下这一点。
BYD 是低成本领导者,也是安全领导者。安全尤其重要:往一颗 NMC 电芯里钉钉子,它会起火,热失控传导到邻近电芯,邻近电芯也起火,连锁蔓延。往一颗刀片 LFP 电芯里钉钉子,它只会稍微变热,损伤被局限。
财务实力
BYD 通过持有巨额应付账款形成的“浮存金”(应付账款周转天数 DPO 为 100 天),在与第三方供应商的博弈中体现出强势;这会抬高经营性现金流。随着 BYD 从政府客户转向消费者/商业客户,应收账款天数(约 33 天 DSO)的显著下降,叠加应付账款天数的扩张,带来约 50–60 亿美元的一次性“风fall”,并在很大程度上为其全球工厂建设提供资金。这或许是伯克希尔的重要洞见之一。
注意:若计入 BYD 金融业务的应收款,DSO 大致会翻倍,但那反映的是贷款资产应收款,而非经营。上述数字聚焦于制造业务及其营运资金状况。下图中的数据同样代表制造业务,并未包含金融业务。
[
](https://substackcdn.com/image/fetch/$s_!JXwd!,f_auto,q_auto:good,fl_progressive:steep/https%3A%2F%2Fsubstack-post-media.s3.amazonaws.com%2Fpublic%2Fimages%2F8af82254-161b-4448-be2a-12aa51180e3a_2324x1162.png)
上图展示了 BYD 在过去二十年的演变。
2009–2013 年,电池与手机是主力产品。随着 BYD 规模扩大带来对供应商的议价力,BYD 拉长了应付账款周转天数(DPO)。
2014 年,北京大幅扩大电动车补贴,并推动政府车队电动化。2014–2019 年,政府采购方向 BYD 发送补贴和车队购车款——速度非常慢。政府应收款的增长快于 BYD 对供应商的议价扩张。应收账款一度飙升至 180 天 DSO,BYD 的现金转换周期(CCC)在高点升至相当“有毒”的 +144 天。
自 2020 年起,BYD 聚焦消费者/商业销售,把 DSO 压到历史低位,并在过去三年把现金转换周期推向负值。这正是 BYD 受益的营运资金浮存金——也就是前文所述那约 50–60 亿美元的营运资金释放,持续为 BYD 的国际扩张提供资金。
现在,BYD 可能会遇到反向冲击。2025 年 6 月,一个行业组织承诺在全行业降低应付账款天数。如果 BYD 遵循,并且看起来它正在与供应商一起拆解其票据体系,那么可能会带来约 100 亿美元的一次性现金流打击。当然,这会伤害多数中国车企,但 BYD 相对损失更大,因为它使用的票据体系在某种程度上更“BYD 独有”。对此的清晰信息可能会压低 BYD 股价,从而创造潜在的买入机会。这是我希望能把 BYD 推向我理想目标买入价的负面催化之一。
BYD 的经营利润中,研发费用占比高达 94%,且研发增速快于营收,因此研发对利润的拖累仍在扩大。BYD 的利润率看起来像典型车企:略低于 5%。然而,BYD 仅将 6% 的研发资本化,而同行通常约 30% 左右;若做同口径对比,BYD 的利润约比“应有水平”低 25%。2025 年及前三个季度,BYD 的研发总额几乎是净利润的两倍:60 亿美元对 32 亿美元。
海外收入占比 29%,并且是增长驱动力。工厂正在泰国、巴西、匈牙利和土耳其建设。欧洲对 BYD 汽车征收 17% 的关税,而对其他中国车企征收 35%。一旦本地生产运转起来,关税将消失——鉴于 BYD 的低成本优势,这将成为其在欧洲的重大未来竞争优势。
BYD 很明智地没有把美国作为重点市场。美国对中国的反感两党一致,这也帮助特斯拉在美国投资者面前维持其“幻象”。
BYD 在国内正面临愈发激烈的竞争:超过 125 个中国电动车品牌。它拥有规模优势与显著且耐久的成本优势。BYD 在其售价水平下仍然盈利,而几乎所有主要中国电动车竞争对手都做不到。BYD 的研发投入与领先优势正在扩大。
目前,消耗战仍在继续——BYD 的 3Q2025 显示,在中国市场利润环比出现两位数下滑;全年下滑约 7.5%。长期来看,BYD 将保持头部位置,并且在任何情景下都应保持盈利。如果 BYD 都赚不到钱,竞争对手将被淘汰,BYD 的竞争地位反而会提升。
BYD 的信息披露世界级,与腾讯并列为我研究过的中国公司里最出色的一档;在本系列讨论的其他中国公司中(除了 CATL),没有谁的海外扩张速度能与 BYD 相比。
地缘政治风险包括潜在的 1260H 指定。奇怪的是,BYD 在 2026 年 2 月被加入五角大楼的中国军工企业名单——但该名单在几小时后又被撤回。副国防部长在 2025 年 10 月建议将 BYD 纳入名单,而这项建议至今仍然有效。未来该名单可能再次发布,BYD 股价可能因此受挫。这会是潜在的买入机会,因为 BYD 并没有国防部/战争相关敞口。腾讯和 CATL 等股票在被列入 1260H 后的初步下跌中也曾反弹。
此外,欧盟正在调查匈牙利工厂的补贴问题,可能还会给 BYD 带来麻烦。
以约 HK$95/股计,BYD 约 1100 亿美元市值,对应约 6.5 倍 2026 EV/EBITDA,0.8 倍 2026 营收。尽管海外投入巨大,BYD 资产负债表上仍显示净现金。
表观市盈率为 2026 年盈利的 17 倍。若将研发费用调整为行业标准口径,市盈率可能更接近 13–14 倍。营收增长为 9–10%,随着投资落地,可能提升至 15%。
随着海外工厂投产,前瞻投入资本回报率(ROIC)预计为 13–18%;但过去一个世纪里,长期来看汽车行业一直是糟糕的投资——它们能活得很久,却很难给出可观回报。我认为 BYD 今天是一家极其运营出色且技术先进的公司,且我相信长期 ROIC 会稳定在 10% 以上。
BYD 在 2025 年生产约 430 万辆车,其中海外超过 100 万辆,经营杠杆自 2022 年以来确实快速提升。海外层面在这一指标上仍有多年的改善空间。
BYD 的营收比特斯拉高约 29%,但市值仅为其约 1/12。特斯拉股东在未来机器人上押注很大。BYD 售出 176 万辆纯电(BEV),特斯拉为 179 万辆。
我给 BYD 在当前价格下的评分为 7/10。7/10 意味着温和买入、小仓位,或等待 8/10 价格,即 HK$75。
如果到那时论点仍成立,我会在 HK$75 或更低价位积极买入。这对应于 10 倍“归一化”盈利倍数,匹配潜在最坏情形下 10% 的长期 ROIC。以我的经验,除了上述投资逻辑与优秀披露外,10x/10% 这一组合非常强劲,通常带来 15–20% 的年化上行。原因在于:若我的投资论点正确,未来倍数与 ROIC 都可能超预期。
若在近期 HK$95 附近买入——如果是我——我会把仓位做轻,比如 4%,并预留空间:若跌到 HK$75 且论点依然成立,就把仓位积极加倍到 8%。BYD 将在本月稍后公布业绩并发布年报。我会很有兴趣地阅读。
立即订阅
海底捞国际(6862 HK)
海底捞由张勇于 1994 年在四川创立,是中国唯一的全国性火锅连锁。火锅是中国的饮食常态:每桌食客在一口共同的锅里涮煮食材,锅中是辣味热汤。这种偏重庆/老四川的麻辣火锅变体如今最为主流。重庆/老四川花椒与一种特殊的发酵豆瓣酱构成了其标志性的风味与辣度基础。
海底捞在这一市场中占有 2.2% 的份额,几乎是最近竞争对手(0.8%)的三倍。海底捞的长期增长跑道仍然相当长。海底捞最出名的是服务,稍后详谈。
上市主体海底捞国际是 2015 年成立的开曼群岛继承公司。这家开曼公司就是完整的公司本体,拥有其全部子公司。它不应与 VIE 结构混淆:VIE 结构使用的开曼控股公司只是一个空壳,第一部分已讨论。
通过在香港购买 6862 HK 的普通股,投资者获得的是对中国最大、且唯一全国性火锅连锁的纯粹普通股所有权——公司注册在开曼群岛。
在结构上,投资者需要知道:原先的前身公司四川海底捞餐饮,允许海底捞国际免版税使用品牌“海底撈”,而该前身公司由海底捞国际的 70% 持股人、创始人张勇约 75% 控制。
“海底撈”似乎意为“从海底捞起”,这句话与火锅意象非常契合。
我想不出任何理由,能够解释为什么控制 6862 HK 约 70% 的创始人会把品牌从经营体系里拿走。这一结构远早于 IPO 便已存在,有点像“退化的尾巴”。无害。我在这一安排中看不到值得担忧之处。
那次错误?
海底捞国际是一家成功、不错的中国公司,但做过一件非常糟糕的事。下面这张图带我们回顾。
[
](https://substackcdn.com/image/fetch/$s_!9Fek!,f_auto,q_auto:good,fl_progressive:steep/https%3A%2F%2Fsubstack-post-media.s3.amazonaws.com%2Fpublic%2Fimages%2F62d5ffc3-2a35-43dd-a624-3f9a9a623b6c_2324x1216.png)
2015–2017 年,海底捞在 IPO 前的增长节奏平衡而健康,自由现金流被再投入业务。
2018 年,海底捞在香港上市,管理层把募资大举投入扩张,在 2020–2021 年(COVID 的第一年)命运般地开出 540 家门店。
固定资产(Property, Plant & Equipment,PP&E)在 2020 年 12 月达到峰值,人民币 196 亿元。
到 2022 年,中国进入严厉封控,海底捞计提减值核销了其 PP&E 的 68%。为稳定业务,海底捞关闭了三百家门店。这既是一次戏剧性的失误,也是不幸到近乎灾难的霉运:它已经加速扩张,并在 COVID 来临后错误地坚持了原计划。
同在 2022 年,海底捞在重组中剥离了颇具前景的海外业务。剥离后公司 Super Hi 在香港上市,股票代码 9658 HK。
2023 年至 2024 年,尽管自由现金流快速上升、资本开支缩小,股价仍持续承压。2024 年,在消费环境艰难的情况下,海底捞仍创造约 8.7 亿美元自由现金流。
2024 年期间,管理层为了表达信心,将约 94% 的净利润以股息形式分配。按近期价格,这相当于约 6% 的股息率,且没有金融负债。海底捞几乎所有门店都为租赁,且大多数租约附带终止选项。这也是它能迅速关闭数百家门店的原因。
2025 年全年数据尚未公布。我们知道,由于中国消费者疲弱,营收承压。另一方面,近期的外卖大战可能给海底捞带来助力——下文会谈到。
立即订阅
火锅之王
海底捞的经营业务受益于一种颇具亚洲特色的垂直整合方式。海底捞的一部分需求(装修、调味品、物流)由一套与创始人关联的“姐妹公司生态”提供。通过关联方发生的成本约占其总成本的 ~40%。 关联方交易(Related-party transactions,RPTs)在证券分析中通常当然是负面信号。
[
](https://substackcdn.com/image/fetch/$s_!4Fnx!,f_auto,q_auto:good,fl_progressive:steep/https%3A%2F%2Fsubstack-post-media.s3.amazonaws.com%2Fpublic%2Fimages%2Fd5a60e0e-199e-4e06-845e-05a4341f0329_640x245.png)
有趣的是,这些 RPTs 在总体上似乎反而帮助了海底捞的经营。比如,供应调味品的颐海国际 (1579 HK) 同样由海底捞创始人控制,但其销售毛利率随着时间推移有所压缩。这并不是说颐海在压低自身利润来帮助海底捞,但它显然也并未对海底捞“宰客”。稍后我会再谈。
中国国内市场充斥假冒与伪标,即便在食品链条中也存在。比如京东的一项竞争优势,就是为客户提供大量可信、正品的品牌商品。海底捞同样声称,这种整合是食品安全、低装修成本、可控物流成本等的关键。
由于创始人控制交易两端,他完全可以把利润在两边之间来回“调节”。就目前数据来看,似乎对海底捞更有利。创始人控制海底捞约 70% 股权,因此即便从自利角度,也更偏向海底捞一边。比如他仅持有颐海约 35%。当然也可能——人们愿意相信——他只是公平对待两边,而在中国,只要产品质量得到保证,这种“公平”本身就是巨大优势。
总体而言,这些 RPTs 似乎在某些方面给海底捞带来成本与质量优势;这在任何地方都重要,但在中国尤其重要,甚至可能是规模化所必需的。
然而,海底捞最大的错误——注定失败的 COVID 扩张——确实让创始人兄弟的建筑公司北京蜀韵东方受益。这是一家私营公司,没有公开财务披露。蜀韵东方确实在 2020–2021 年间非常快速地建成那 540 家海底捞门店,在 COVID 期间、且就在中国封控之前,收取约 6.2 亿美元。
对比其他上市竞争者后,每家门店的建设成本大致相当,这令人稍感欣慰。但如此仓促的扩张仍然可疑:可能是极其恶劣的“薅羊毛”、代价高昂的错误,或两者兼而有之。
尽管如此,把已披露的关联方付款完全纳入分析,是良好习惯。总体披露一直非常不错。然而,对这家兄弟建筑公司的付款,并非像其他关联方那样出现在年报的同一位置,而是藏在董事会报告(Director’s Report)里。下表汇总了所有这类付款。
[
](https://substackcdn.com/image/fetch/$s_!9Lqg!,f_auto,q_auto:good,fl_progressive:steep/https%3A%2F%2Fsubstack-post-media.s3.amazonaws.com%2Fpublic%2Fimages%2F194faa01-fca0-42c1-8513-9fa005453954_1844x811.png)
关联方现金流出占营收的比例,已从 2020–2021 年门店扩张期显著下降。创始人兄弟的建筑/物流公司在后续年份收到的金额也大幅减少。如果这曾是一次偏离正道的“薅羊毛”,那么重组与关店已实现自我纠偏。但这并不能为“薅羊毛”开脱;它确实会在一定程度上压低估值,并需要持续监控。
我会关注本月末发布的 2025 年年报,看看是否会进一步说明,以及是否会恢复对颐海与蜀海的付款披露。2024 年的关联方交易占营收比例大概率仍在 12% 左右或更高。我注意到,这些关联方确实提供了真实的服务与商品——问题在于定价是否接近独立第三方交易(arms-length)的水平。
关联方交易并非天然为恶,但必须以公允的方式评估。在本案中,就已披露的付款与合作而言,我看不到侵害股东的证据。像这样的公司——而且亚洲市场里有大量这种公司——必须像我上面做的那样拆解:识别每一笔付款与每一处冲突。要做好监控,首先就必须把所有事项完整纳入核算。
公司在培训员工方面投入很大,以确保在 1300 家门店里都能提供一致、优质的服务与用餐体验。许多中国餐厅并不重视服务,因此环境设计与服务体验可以让一家餐厅脱颖而出,而海底捞似乎确实做到了。海底捞在中国以标准化产品与“额外服务”著称——比如 24 小时营业、服务员帮你把头发扎起来或给手机套塑料袋;热毛巾很快就会被换成新的;等位时有免费饮料和零食,甚至还有免费美甲、擦鞋。
在某些方面,海底捞像是把豪华酒店和火锅店混在一起。它似乎奏效了,并成为顾客善意/品牌的一部分。餐饮行业里“顾客第一”的卓越工作文化常常令人赞叹,但很少被复制。
美团、京东与阿里在外卖大战中花了约 1000 亿元(约 140 亿美元,相当于美团全年总营收的约 30%,以及京东年利润的约 3 倍!)去换取彼此摧毁利润率的“特权”,这反而总体上利好餐厅。火锅在中国餐饮中占 14%。日均外卖订单从 1 亿暴涨到 2.5 亿。我再说一遍:日均 2.5 亿单。哇。
当京东以“商家零佣金”招募高端连锁时,海底捞和星巴克被点名为目标。这意味着这些公司是在京东补贴下获得客户。这也是海底捞去年年底走强的原因之一——其他餐饮连锁也因同样原因上涨。
复旦大学的一项研究发现,外卖大战会增加外卖订单,但以堂食客流为代价。
当堂食被外卖蚕食的阶段结束后,海底捞整体上很可能会拥有更多顾客。其中一些——大概相当一部分——会在时间推移中转为堂食顾客。海底捞为此仍然没有付出成本。
更妙的是,作为全国性头部餐饮连锁,海底捞在外卖“战士们”投放的广告中被重点展示。
在这一点上,全国连锁获得了最昂贵的曝光,而这些曝光全部由外卖平台买单,因此全国连锁相对于区域与小型竞争对手的领先优势会被拉长。即将发布的年报应能很好地揭示这一动态如何发展。
立即订阅
金锅(Pot of Gold)
海底捞向顾客预收款项,但对供应商有大量应付款。COVID 期间,海底捞将应付账款周转天数(DPO)拉长至惊人的 57 天。
这是否证明创始人利用姐妹公司来“帮扶”海底捞?颐海披露其来自关联方的应收款规模不小。因此,创始人可能不仅能调节成本,也能调节现金流;而就现金流而言,没有证据显示海底捞处于不利,恰恰相反。
[
](https://substackcdn.com/image/fetch/$s_!muqd!,f_auto,q_auto:good,fl_progressive:steep/https%3A%2F%2Fsubstack-post-media.s3.amazonaws.com%2Fpublic%2Fimages%2F96037661-b1fb-4072-bfb9-accb42df5cda_2337x1428.png)
海底捞从食客处立即收取现金与信用卡付款,生鲜食材周转也快,因此公司仅持有 21 天库存,却在 37 天后才向供应商付款。注意,37 天并不异常,也不构成对供应商的压榨——它处于常见的 30–45 天标准区间。但该商业模式却能产生永久为负的现金转换周期。
颐海及其他关联方甚至未必在“帮”海底捞多少。也可能只是商业模式本身决定:供应商——甚至顾客——创造了显著的浮存金,为海底捞全部经营融资。无论如何切分,海底捞都获得了现金流增益,而 RPT 的担忧基本上不再关键。
凭借约 110 亿元人民币现金,海底捞的现金与现金流状况非常稳健。
[
](https://substackcdn.com/image/fetch/$s_!9hky!,f_auto,q_auto:good,fl_progressive:steep/https%3A%2F%2Fsubstack-post-media.s3.amazonaws.com%2Fpublic%2Fimages%2Ff3f583d4-1dfc-4a97-947a-7ea40ede4104_778x458.png)
上图显示海底捞拥有约 50 亿元人民币的浮存金——一池永久的、免息资本,规模几乎相当于营收的 12%。随着海底捞增长,这一浮存金还会继续增长,因为它是商业模式的一部分。
注意,预付礼品卡占浮存金的 20%,且自 2017 年以来已增长三倍。
另一个细节是:由于那场命运般的门店扩张与随后逆转,仍有一层暂时性的折旧压力压低盈利。随着这一错误逐年从资产负债表经由利润表消化,利润率会机械性抬升。
[
](https://substackcdn.com/image/fetch/$s_!QHdD!,f_auto,q_auto:good,fl_progressive:steep/https%3A%2F%2Fsubstack-post-media.s3.amazonaws.com%2Fpublic%2Fimages%2F8c07708b-5a96-46cf-bb9a-6458dd015a74_794x458.png)
这张图显示,这股盈利顺风已经发生,并将持续几年。
海底捞已开始将品牌做加盟。公司并未正式宣布,但在 2024 年以及过去一年,其申报材料中出现了一条来自加盟商的经常性“加盟费收入”科目。这是经济机会,但也可能对文化与质量构成风险。其受控供应链应有助于在这些方面维持一致性。
海底捞的上行空间与主要风险,都来自其作为中国消费者纯粹押注的属性。出于前面讨论的所有原因,这可能是走向日本化的死胡同,也可能是长期希望/预期——取决于你的观点。去年营收下降至低个位数。公司会发放股息。
公司市值约 117 亿美元,交易在约 18 倍市盈率;而现金流更高——由于负现金转换周期带来的经营现金流略低于 10 亿美元,自由现金流约 8.7 亿美元。净利润率 9–10% 已回到扩张前水平。
我喜欢这家公司作为中国消费复苏的押注。它也是一个非 VIE 的“纯中国”标的:若美国对 VIE 结构采取行动,它可能受益。
该股近期与其他非 VIE 股票一起走强,或许验证了这一策略。公司与股票不存在特定证券层面的制裁风险。
我给海底捞在当前约 HK$17 的价格下评分 8/10——这意味着正常仓位可买入,约 5–6%,主要取决于流动性。我会在 HK$15 继续加仓;若跌到 HK$13 或更低,且论点仍成立,我会把仓位提高到 8–10%。
海底捞将在本月末 3 月 31 日披露业绩,并发布 2025 年年报;年报里,疲弱的中国消费者将与外卖大战正面相遇。
立即订阅
PDD Holdings (PDD, formerly Pinduoduo)
早在 Temu 之前,前谷歌员工黄峥创立了 PDD:一家采用 VIE 结构的电商公司,目前是中国利润率最高的电商企业,并且拥有一种极端到连空头与多头都一度怀疑其可能造假的融资策略。
2015 年,黄峥利用腾讯无处不在的即时通讯应用,把买家组织成团,以极低价格购买易腐农产品再转售。PDD 这样做亏了很多钱,于是 2017 年黄峥放弃这一策略,转型为纯粹的互联网平台公司,撮合农户直接向买家代发货。这一转向使毛利率在 3 个季度内从 -47% 飙升到 +56%。几乎不可思议的转身,在财务报表中清晰可见。
PDD 接到订单、安排代发货,然后 不 向农户供应商付款,拖欠 500–600 天。没看错。黄峥当时经营的是一家全新、资本金不高且仍在亏损的公司,但即便如此,他/ PDD 对其大多为农村与工业供应商的议价力之大胆,令人震惊。
随后,PDD 将工业供应商也引入拼多多平台——而且令人惊讶的是,仍把应付账款天数维持在 500–600 天。PDD 通过把约 4200 亿元人民币(接近 600 亿美元)本该支付给商家的款项“扣住不付”,再投资于短期工具,从而赚取可观的投资收益。
2018 年 7 月,PDD 上市,在纳斯达克挂牌 ADR。
2018 年 11 月,做空机构 Blue Orca 调查了 PDD 在中国的两家 VIE,并发布报告称:按这些监管申报文件,PDD 的总收入仅为 12.46 亿元人民币,而 PDD 向 SEC 提交的招股书披露收入为 19.51 亿元人民币,潜在高报 57%。Blue Orca 还称,PDD 在 SAIC(工商)申报的经营亏损比向 SEC 申报的亏损高出 65%。
这很可能是由应付账款浮存金解释的。PDD 似乎通过一个支付处理实体/VIE 把现金流入导入受限账户,并在 500+ 天后再分配给商家。Blue Orca 检查的 2018 年 Q2,PDD 的现金持有量竟高达当季营收的 7 倍,且其投资收益与收入很可能足以填补 Blue Orca 所指出的缺口。
做空报告发布当天,股价上涨了 12%。也许投资者看到做空报告后自行调查,正确识别了三家 VIE(或两家 VIE 加支付处理实体),并印象深刻。SAIC 报告如今已无法供投资者审阅,因此我目前无法分析这些文件。
说到分析,Blue Orca 去嗅探并非没有道理。PDD 的披露充其量只能算糟糕。PDD 的营收没有任何拆分——没有按国家、也没有按业务分部。PDD 最后一次披露分部营收是在 2018 年 Q2——两项:商品销售与线上平台服务销售。2019 年才出现一条“交易服务”(Transaction Services)科目,披露收入 8.229 亿元人民币——这很可能就是支付处理 VIE。此后,再无任何关于营收结构的信息。
回想马云单枪匹马把支付宝资产从阿里 VIE 中转走。PDD 这种转瞬即逝的披露让我觉得,“交易服务”很可能是 PDD 中非常关键的一块。它或许处理应付账款浮存金的收益。在黑暗中,可能藏在一个披露糟糕的 VIE 里——在北京。
当披露出现怪异之处时,重要的是对类似公司做对照法证分析。我做法是:先审视 PDD 的潜在红旗,再用同样维度检查可比公司。下表汇总了这套对 PDD 的分析,并以京东与阿里作为对照。
[
](https://substackcdn.com/image/fetch/$s_!hxUf!,f_auto,q_auto:good,fl_progressive:steep/https%3A%2F%2Fsubstack-post-media.s3.amazonaws.com%2Fpublic%2Fimages%2Fccf49fb4-e65a-4ca4-951d-4730f281ea0e_1400x2095.png)
从上表来看,我无法把“红旗”插在地上、直接宣称造假。Blue Orca 很可能没有检查三家 VIE 中的某一家,或者忽略了支付处理业务作为收入与现金流来源。我的对照法证分析中没有其他内容足以支撑“造假”的指控。更多是:披露很差。
PDD 的披露问题令人烦躁。它那种非正统的自举式成功看起来增长得过于指数级,以至于披露难以跟上——如果披露跟上这件事本身可行的话。我希望这不是内部控制不足的反映。
下图显示,至少到 2021 年 Q2,应付账款浮存金的利息收入就是 PDD 利润的全部。Temu 出现前的应付账款浮存金堪称史诗级。
[
](https://substackcdn.com/image/fetch/$s_!h8YU!,f_auto,q_auto:good,fl_progressive:steep/https%3A%2F%2Fsubstack-post-media.s3.amazonaws.com%2Fpublic%2Fimages%2F7f975d1a-c8f5-4b14-8942-c6c6f766560b_813x451.png)
黄峥在 2021 年彻底从 PDD 退出。2022 年 9 月,PDD 推出 Temu:面向国际消费者的白牌代发货业务。随着 Temu 上线,应付账款天数立刻大幅下降,随后从 2023 年 Q3 起稳定至今,仍处于显著偏高的水平。到 2024 年,Temu 成为美国下载量最高的购物 App,并在 70 个国家运营。
营收在 2024 年初仍以 100% 左右的速度增长。
随后竞争开始反击。京东将其平台招商家数量提高 200%,阿里则在三四线市场推出 Taobao Deals,直接进攻原本属于 PDD 的腹地。
[
](https://substackcdn.com/image/fetch/$s_!Sp8x!,f_auto,q_auto:good,fl_progressive:steep/https%3A%2F%2Fsubstack-post-media.s3.amazonaws.com%2Fpublic%2Fimages%2F2d0df863-09d0-4b14-bc1d-cffbccb862d0_3221x1281.png)
上图跟踪了 PDD 营收增长的“双子塔”:先是国内的拼多多,再是国际的 Temu。当然,麻烦并不仅限于中国竞争。
美国在 2025 年取消了 Temu 用来免关税向美国发货的 de minimus 漏洞。Temu 转而改为向美国本土仓库批量发货,但 Temu 相对沃尔玛与亚马逊那种“便宜且 SKU 无穷”的优势消失了。后两者拥有深厚的实体物流经验,而 Temu 并没有。
PDD 在 2025 年营收增长约 23% 的情况下,EPS 几乎没有增长,因为利润率受挫。毛利率在 2022 年达到 75% 的峰值,如今已跌至 50% 多的区间。
不过,PDD 还没消失,至少目前没有。华尔街对 2026 年的展望并不清晰——普遍预期在竞争压力下营收增速继续下滑(到约 10–15%),而利润可能跟随这一增速,但前提是 PDD 能阻止利润率进一步压缩。PDD 的毛利率比 2022 年 75% 的水平低了约 20 个百分点。
我并不乐观地认为 PDD 在 2026 年还能实现两位数的利润增长。我承认,存在这样一种价值:创始人黄峥再一次做出“不可思议的伟大事情”的概率。但自 2021 年起,他就不再以 CEO 或董事长身份参与公司。
因此,PDD 市值 1550 亿美元,现金 480 亿美元——但我们知道它还欠商家略超 300 亿美元。因此自由现金约 150 亿美元,浮存金约 330 亿美元。随着 PDD 增长,浮存金也在增长,而这很可能继续。浮存金如何、在哪里投资并未披露。
PDD 的净利润中,约每 3 美元就有 1 美元来自对 330 亿美元浮存金 加 自由现金 加 投资组合的收益——合计接近 600 亿美元。这在内部并不自洽。中国短期利率约 1–1.5%。PDD 申报材料提到使用“公允价值资产”(fair value assets),这意味着其资产产生的是资本利得,而非简单利息。我相信这笔投资收益是真实的,但它很可能比银行存款更为波动、也更不透明,流动性或许也更差。PDD 当然没有披露它如何赚到那 49 亿美元投资收益——在截至 3Q2025 的过去 12 个月里,总收入 148 亿美元中有 49 亿美元来自投资收益。真是披露无语。
这也是公司看起来“很便宜”的原因:披露。新管理层也没有改善这种披露水平。我有一种感觉,一切都是合规的,但我无法因此建立足够信心。
鉴于近期审计机构变更,香港二次上市看起来很可能很快发生。PDD 将审计师从北京安永办公室换成安永香港。这一变更自 2025 财年起生效。安永香港使 PDD 的财务与文件脱离 PRC 境内,从而让美国监管机构更容易检查。
更重要的是,香港上市将允许南向投资者通过 StockConnect 终于投资 PDD。这些资金流可能为股价新增一根需求支柱。我很期待评估内地投资者通过买入其股票在多大程度上支持 PDD。
PDD 在五角大楼的 1260H 名单上,这使其进入潜在制裁的雷达,但本身意义不大。看起来更多是美国在与中国外交互动中使用的一种谈判筹码。
我计划在 PDD 香港上市时再重新研究它。由于披露糟糕,尤其在营收构成方面,Temu 的竞争与监管逆风会造成更大冲击。我希望香港上市与新的香港审计师能带来更多披露。
我给 PDD 评分 6/10。
目前我没有 PDD 的目标买入价。如果我认为在这个价格配置 PDD 有意义,那么由于披露问题,它也不应是满仓。我会把它控制在约 2% 左右,大概是我典型满仓仓位的 1/3,直到披露足以令我满意。
在分析 BYD、海底捞,再到现在的 PDD,我从最佳披露一路走到披露存在显著关联交易,再走到披露极差。中间那家是我当前最喜欢的之一,原因很多。其中一个原因是:遮掩白领式“猫腻”比让投资者在完整分析框架下评估这些“猫腻”更糟。
PDD 预计在 3 月 19 日披露业绩,我会在那时重新评估。我会持续跟踪它,并期待业绩发布后不久的年报。
立即订阅
PDD、京东与阿里:估值指标
若不对中国三家电商巨头做一个快速的对照估值,以上对 PDD 的分析就无法形成恰当的参照系。
[
](https://substackcdn.com/image/fetch/$s_!u4Ra!,f_auto,q_auto:good,fl_progressive:steep/https%3A%2F%2Fsubstack-post-media.s3.amazonaws.com%2Fpublic%2Fimages%2Ff719484a-11d3-4a0a-a250-9d6406f34a76_761x949.png)
如上表底部所示,这里引用了那篇文章:Foundations: The Tragic Algebra of Stock-Based Compensation,在评估这些公司时值得一读。
从规模看起。如今它们都已是大公司:京东与阿里营收都超过 1000 亿美元,PDD 也不遑多让,营收达 600 亿美元。
这些业务彼此差异巨大,而各自的盈利能力、利润率把这种差异展现得淋漓尽致。
如果你记得中国消费者一直在存钱、存钱、再存钱,那么从投入资本回报率(ROIC)的角度看,这三家都是优秀的生意。
[
](https://substackcdn.com/image/fetch/$s_!jYnT!,f_auto,q_auto:good,fl_progressive:steep/https%3A%2F%2Fsubstack-post-media.s3.amazonaws.com%2Fpublic%2Fimages%2Feae39e74-a5f9-4881-9491-c9b53b4f87b6_833x599.png)
当消费者情绪改善,支出将随之而来。三家的 ROIC 与盈利能力都有望爆发。在一个近似“大萧条式”的谷底,当前经调整的 ROIC 约 10%,其实并不差。
正如上文所述,PDD 的现金构成大约是 330 亿美元浮存金加 150 亿美元自由现金。但尽管股价大跌,公司却没有回购。这触及 PDD 的不透明性——现金会持续累积,而它将如何使用现金,是个真实的问题。
PDD 也许是三者中最好的生意,但这一判断必须等待。我已经知道:它的披露最差。
评分卡
至于“本文涉及公司的 500 词要点 bullet 目标”,我没做到,向读者致歉。因此,我也对本文完整内容的承诺有些过度。本文呈现的信息或许算是第一部分的一个不错续篇,但显然还不是大结局。
《港股:结构与策略》系列的第三部分将覆盖阿里、京东与美团。它们三者构成了分析“外卖大战”的一组很好、衔接自然的三元组。第三部分也会覆盖第一部分提到的其他公司,包括腾讯,以及可能还有几家。
在系列收官之作中,我将构建并解释我理想的“对冲式”全多头港股投资组合。
希望你学到了一些东西!
下次再见!
Cassandra Unchained 是一份读者支持的出版物。若想接收新文章并支持我的工作,请考虑成为免费或付费订阅者。

